Synchronize Dashboard and Process Discoverer
Understanding process performance typically requires moving between dashboards and process discovery views. For instance, a spike in cycle time in the dashboard might prompt us to examine the underlying event log in Process Discoverer to identify the root cause of this spike. Conversely, after applying filters in Process Discoverer, we might want to view how those filtered results affect the performance metrics displayed in a dashboard.
To make this exploration seamless, Apromore allows us to synchronize browser tabs. We can create a parent-child relation between a browser tab displaying a dashboard and a browser tab displaying Process Discoverer, or between a browser tab displaying Process Discover and a browser tab displaying a dashboard.
A parent-child relation can be created by opening a Dashboard tab from a Process Discoverer tab (or vice versa). When this occurs from Process Discoverer, for example, the operation creates a parent-child relation between the Process Discoverer tab and the Dashboard tab. The Process Discoverer tab is the parent, and the Dashboard is the child. The filters of a parent tab and a child tab are synchronized as follows:
The filter criteria in the parent tab are always propagated to the child tab.
Any additional filter criteria applied to the child tab (after the child tab is opened) are propagated back to the parent tab.
For example, if we open a Dashboard tab from a Process Discoverer tab:
The filter criteria in the active filter of the Process Discoverer tab (the parent tab) are applied to the dashboard tab (the child tab). Any changes to the filter criteria in the Process Discoverer tab are also propagated to the Dashboard tab.
And vice versa, any filter criteria that are added to the event log displayed in the dashboard tab (the child) are also added to the active filter of the Process Discoverer tab (the parent).
From Dashboard to Process Discoverer
When analyzing performance metrics in a dashboard, we may identify an anomaly that requires deeper investigation. Suppose we are reviewing a dashboard widget that shows the performance trend of rejected claims based on the Claims Management Log by applying a filter to the log. We notice that the average case duration for rejected claims peaks in June 2020. To understand what caused this spike, we decide to open Process Discoverer and analyze the underlying process flow.
In the dashboard, click the Discover process icon.
Apromore displays the logs used as data sources in the dashboard. Select the Claims Management Log.
Process Discoverer opens in a new tab with the same filter(s) applied. In our case, the rejected cases.
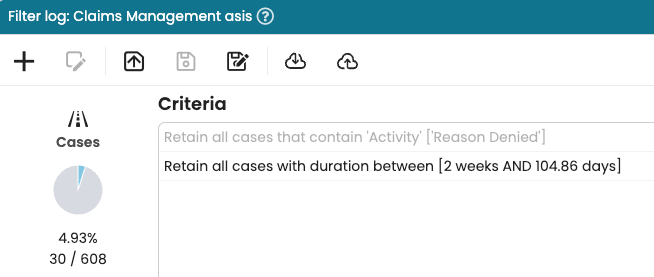
We may decide to apply further filters to understand the root cause. For example, we might focus on cases that took more than two weeks to complete. Create the filter in Process Discoverer.
Click OK to apply the filter. Process Discoverer updates to reflect the new filter, where we can continue our analysis. Additionally, the dashboard widget, which uses the same data source, automatically refreshes to reflect the updated filter.
From Process Discoverer to Dashboard
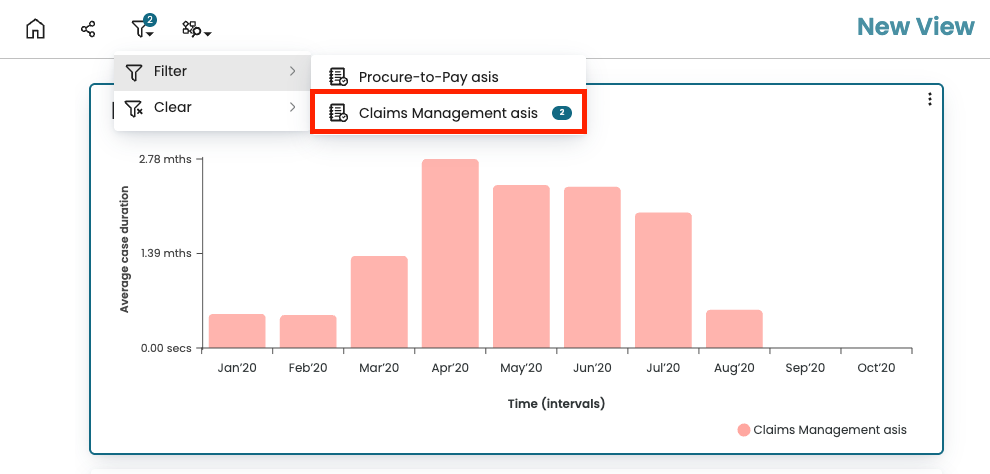
While analyzing an event log in Process Discoverer, we may also want to explore one or more dashboards associated with this event log.
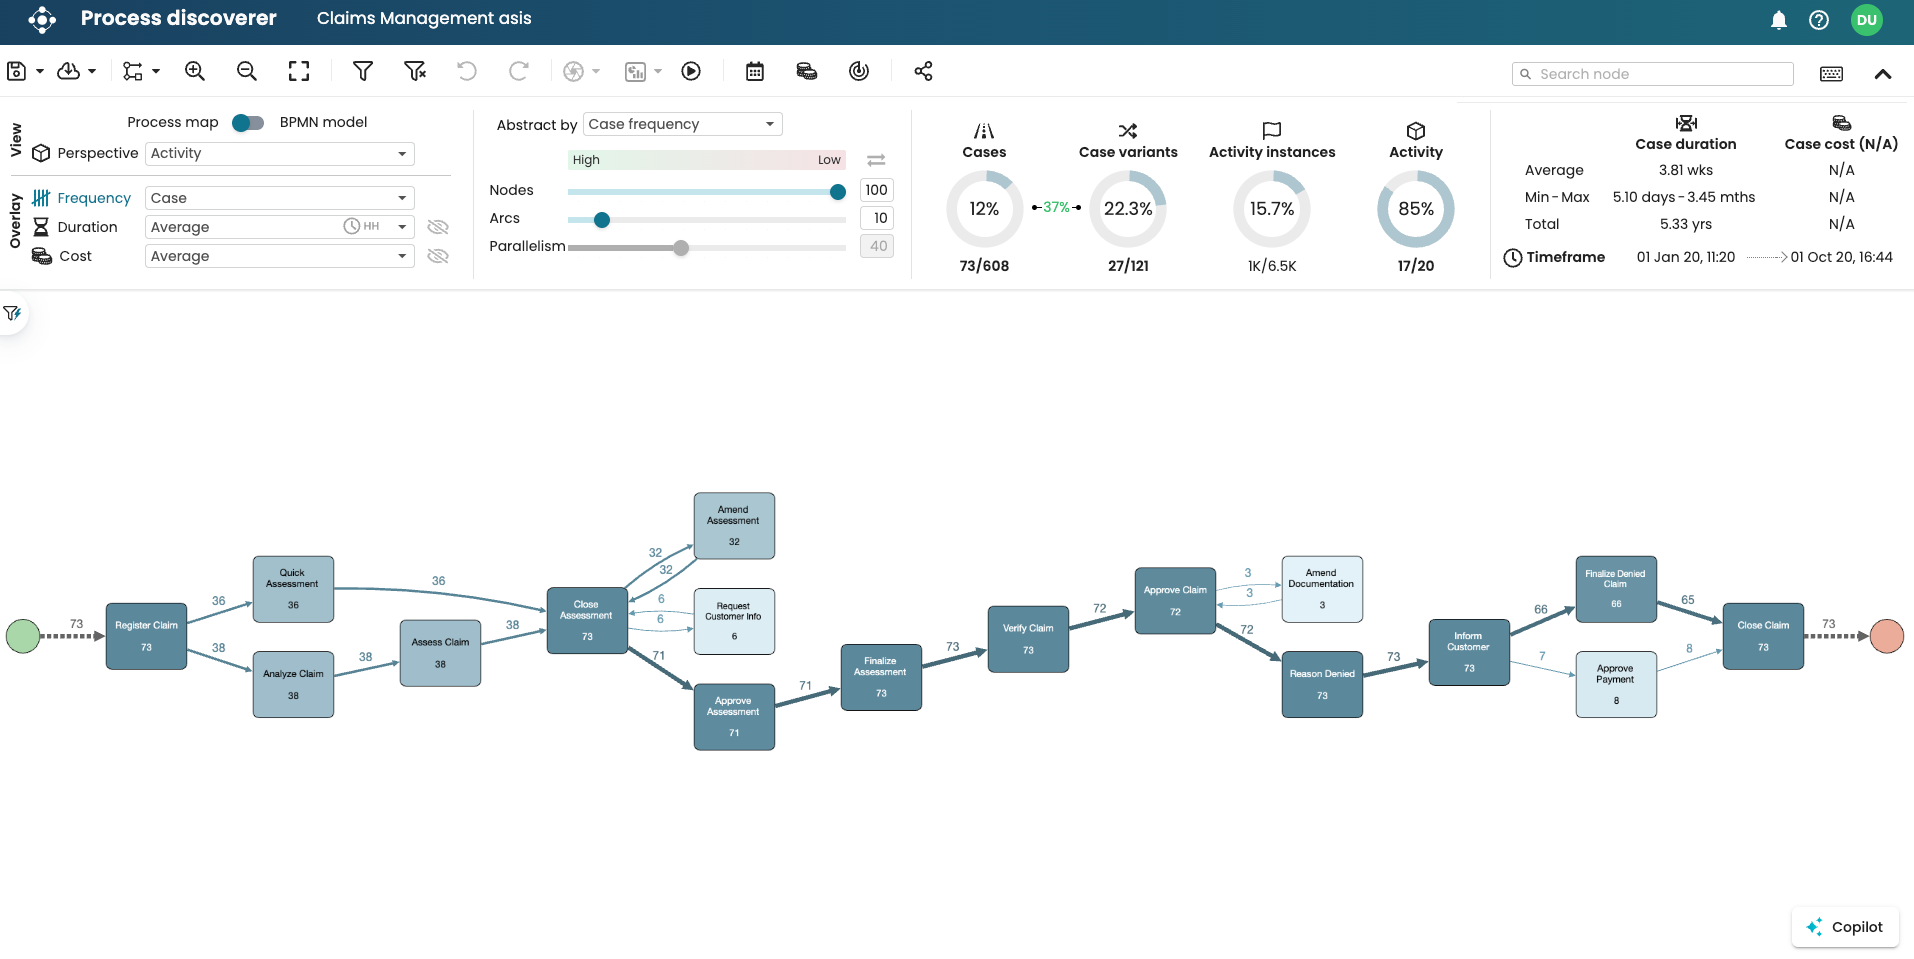
For example, imagine we are visualizing a Claims Management event log in Process Discoverer. Let’s also imagine that we have applied a filter to this log to retain only the long-running claims (those with a case duration of 14 days or more). After applying this filter in Process Discoverer, we may wish to visualize a dashboard that displays the monthly average duration over time for long- running cases.
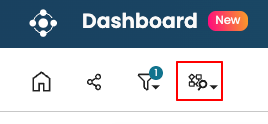
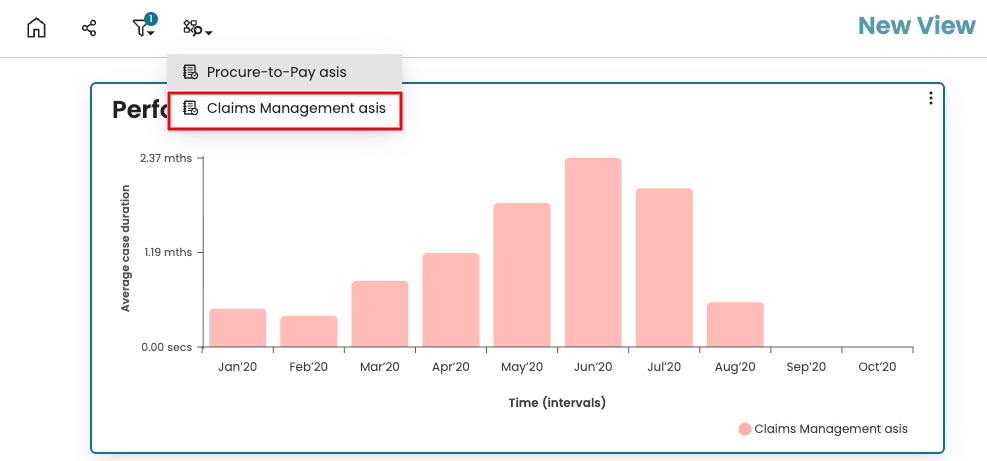
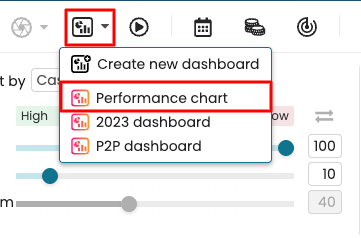
To do so, click the Dashboard icon in the toolbar in Process Discoverer. Select the dashboard we want to open. For example, let’s open a dashboard called “Performance chart”, which uses this event log.
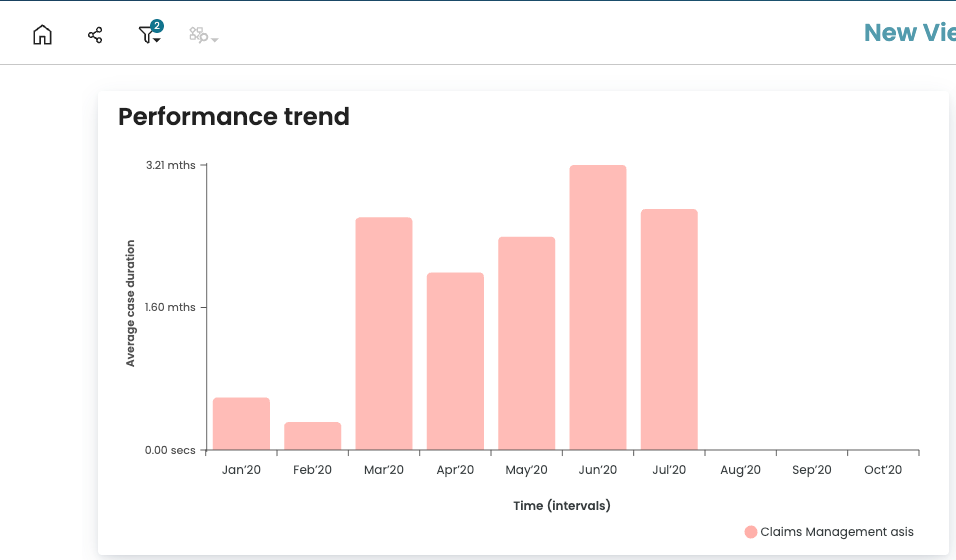
This opens the dashboard. For widgets that use the same data source as the log in Process Discoverer, the filter applied to the log (in our example, cases with a case duration of 14 days or more) is also applied to those widgets.
Note
Any saved filter criteria in a Dashboard tab are propagated to the synchronized Process Discoverer tab, but cannot be edited in the Process Discoverer tab. They appear greyed out.
It is not possible to create “grandchild” relations. After we have opened a Dashboard tab (a child tab) from a Process Discoverer tab (a parent tab), we cannot open another Process Discoverer tab from the Dashboard tab (the child). Conversely, after we have opened a Process Discoverer tab (a child tab) from a Dashboard tab (the parent tab), we cannot open another Dashboard tab from the Process Discoverer tab (the child).