Quick start
This guide will show you how to get started with Apromore. You will discover how to use Apromore to analyze an event log.
Apromore Portal
Head over to your Apromore instance server and log in with your credentials. You will land in Portal, which allows you to interface with your Apromore Workspace.
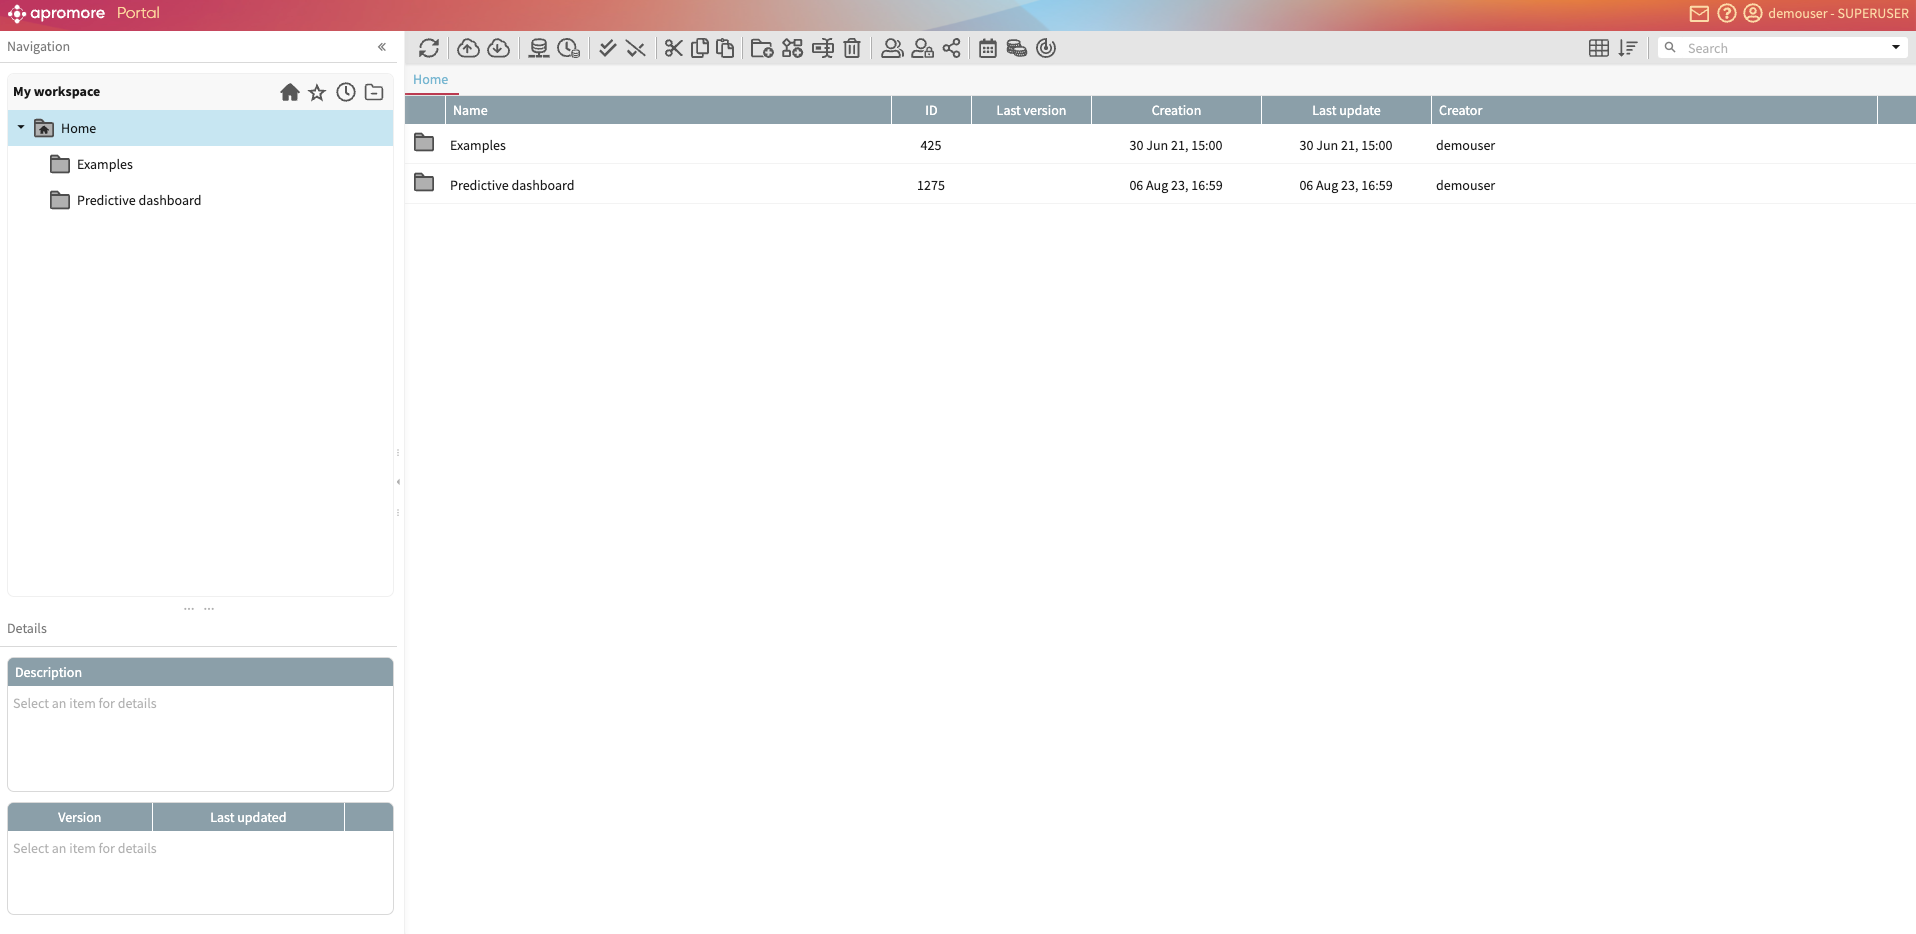
Here, you can organize your event logs and process models into folders. As best practice, it is recommended to organize individual projects in folders. Let us create a new folder for our analysis.
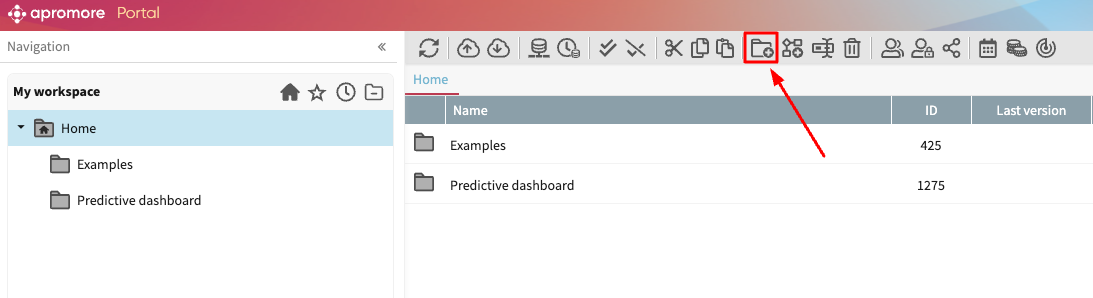
To create a folder, click the Add new button in the top right corner.
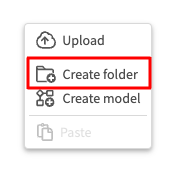
This displays a drop-down of artifacts we can add. Click Folder.
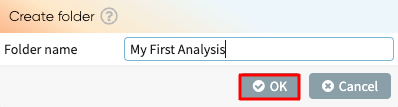
Enter the name of the folder and click OK to create it.
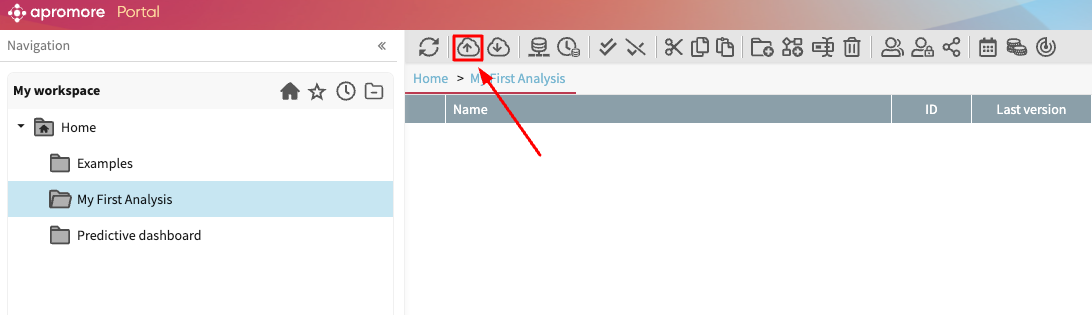
Double-click on the folder to open it. We can upload an event log in the folder to begin our analysis. To upload an event log, click the Add new button. This time, select File upload.
Click Browse to select the file to upload.
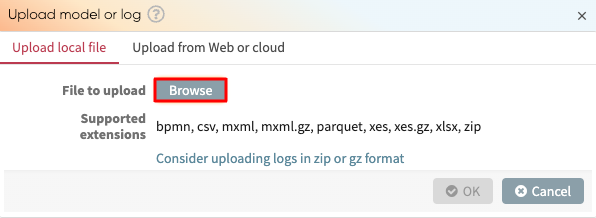
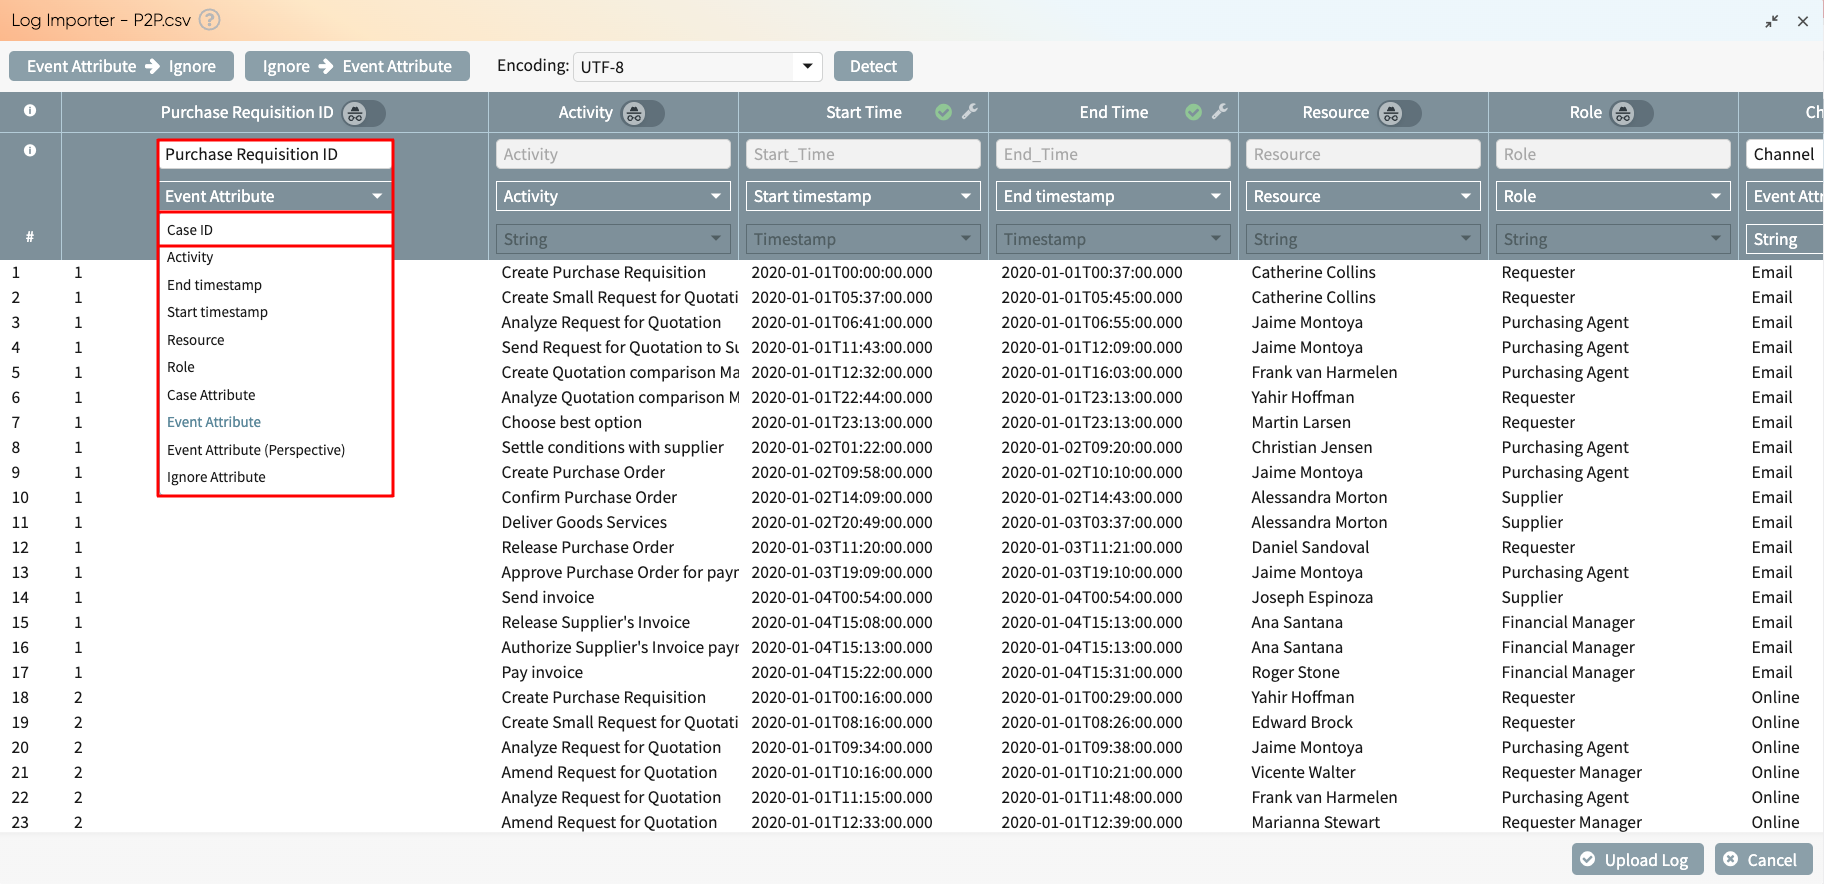
After uploading the file, click OK. The Log Importer window opens up.
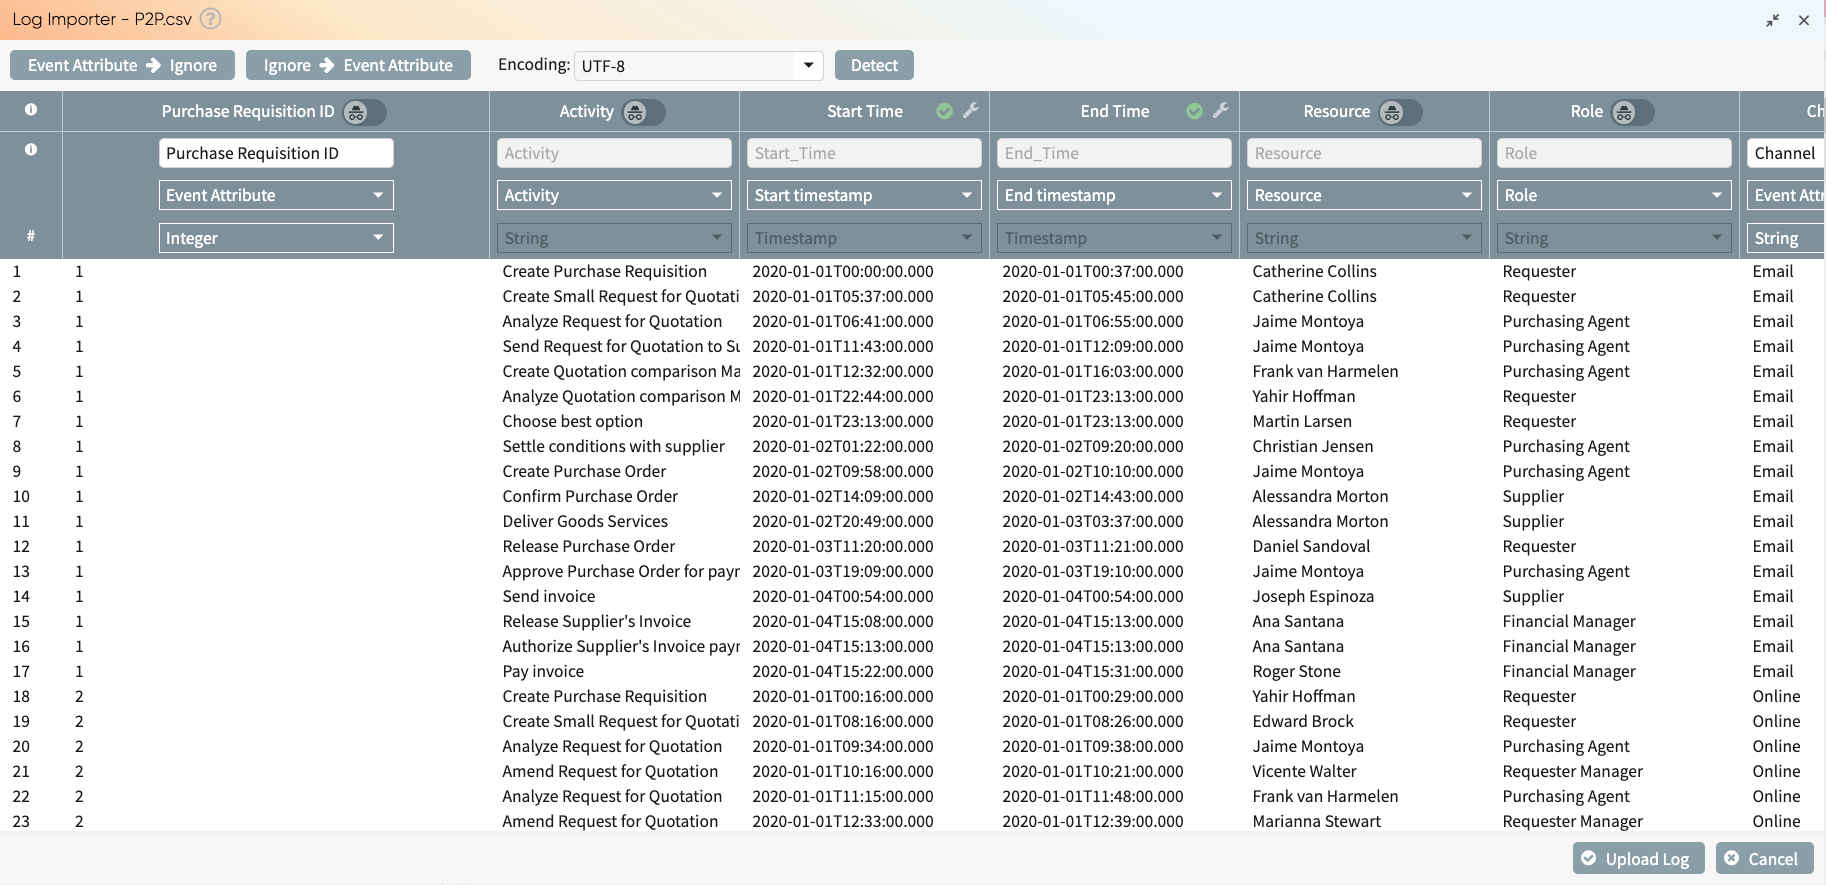
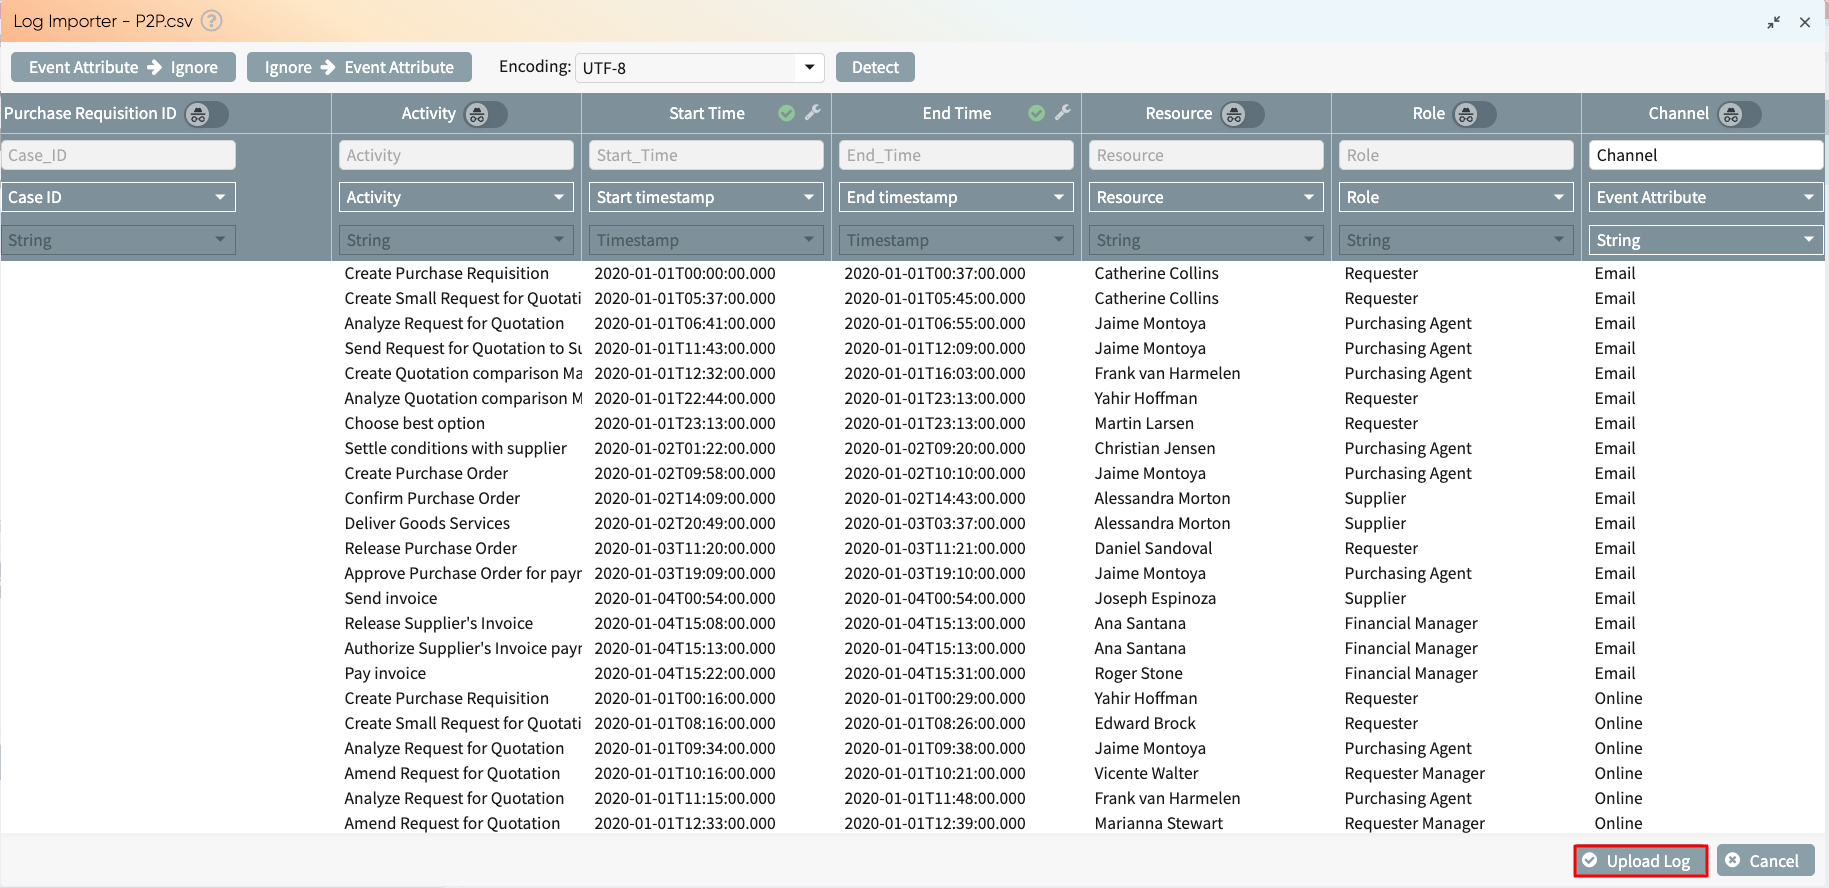
Apromore automatically tags each column to a column type. We can change the column type using the dropdown. For instance, the “Purchase Requisition ID” column should be a Case ID, not an Event Attribute. The role and resource columns are assigned accordingly.
Click Upload Log.
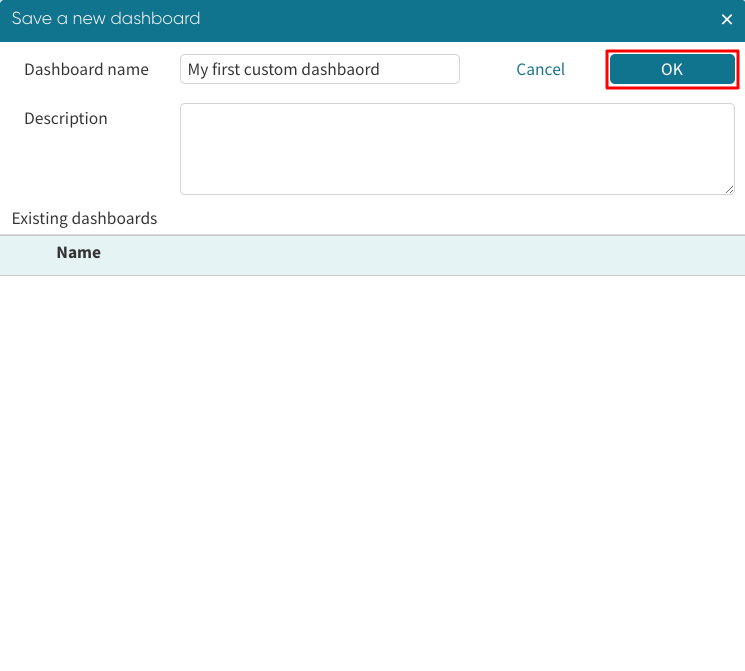
We will be prompted to enter a log name and add a description.
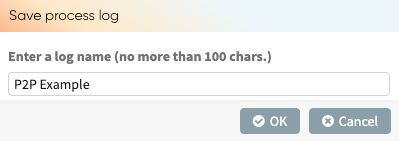
Click OK to upload the log.
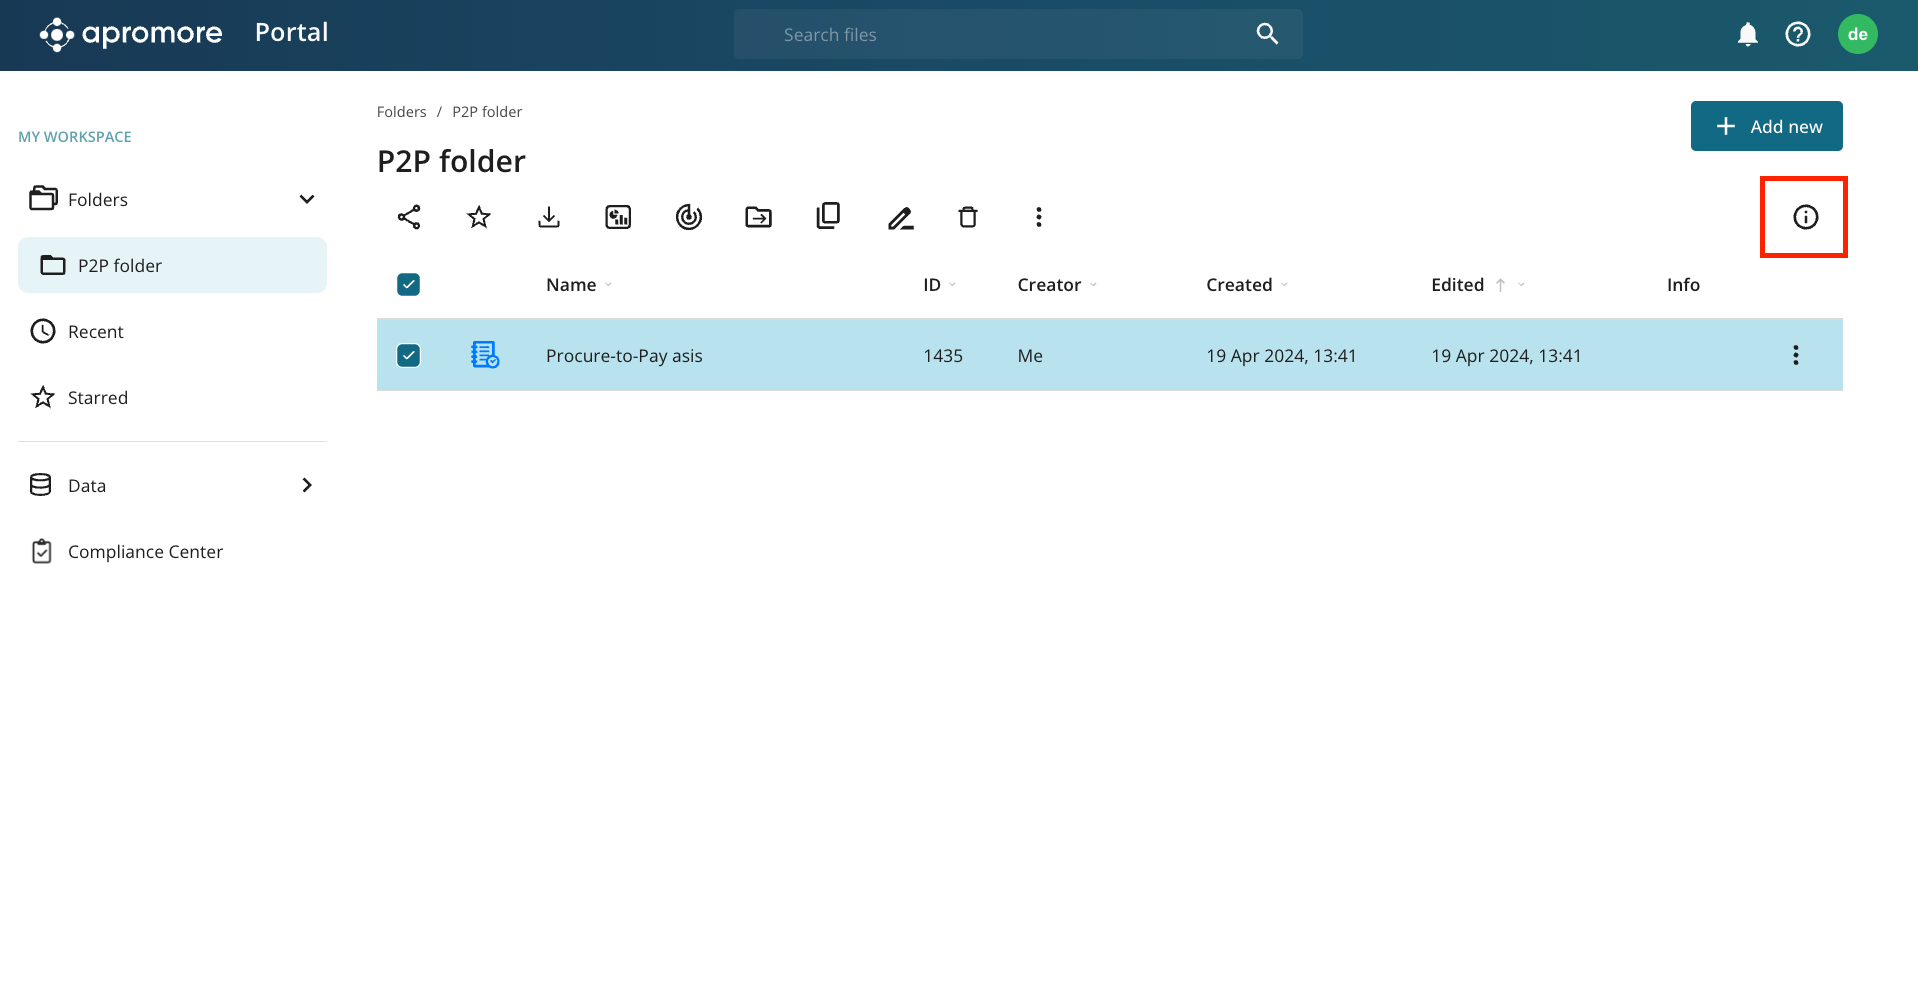
We can view all the log artifiacts in the assets and details panel. Select the log and click the info icon to view this.
Discover a Process
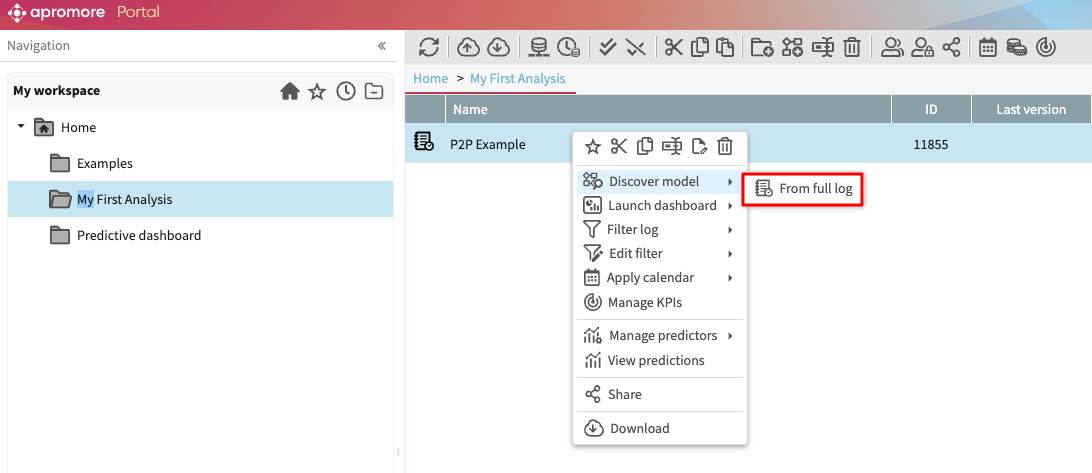
To view the operations we can perform with a log, right-click on the log. Click Discover model > From full log to open the model in Process discoverer.
Alternatively, we can double-click the log to open the model in Process discoverer.
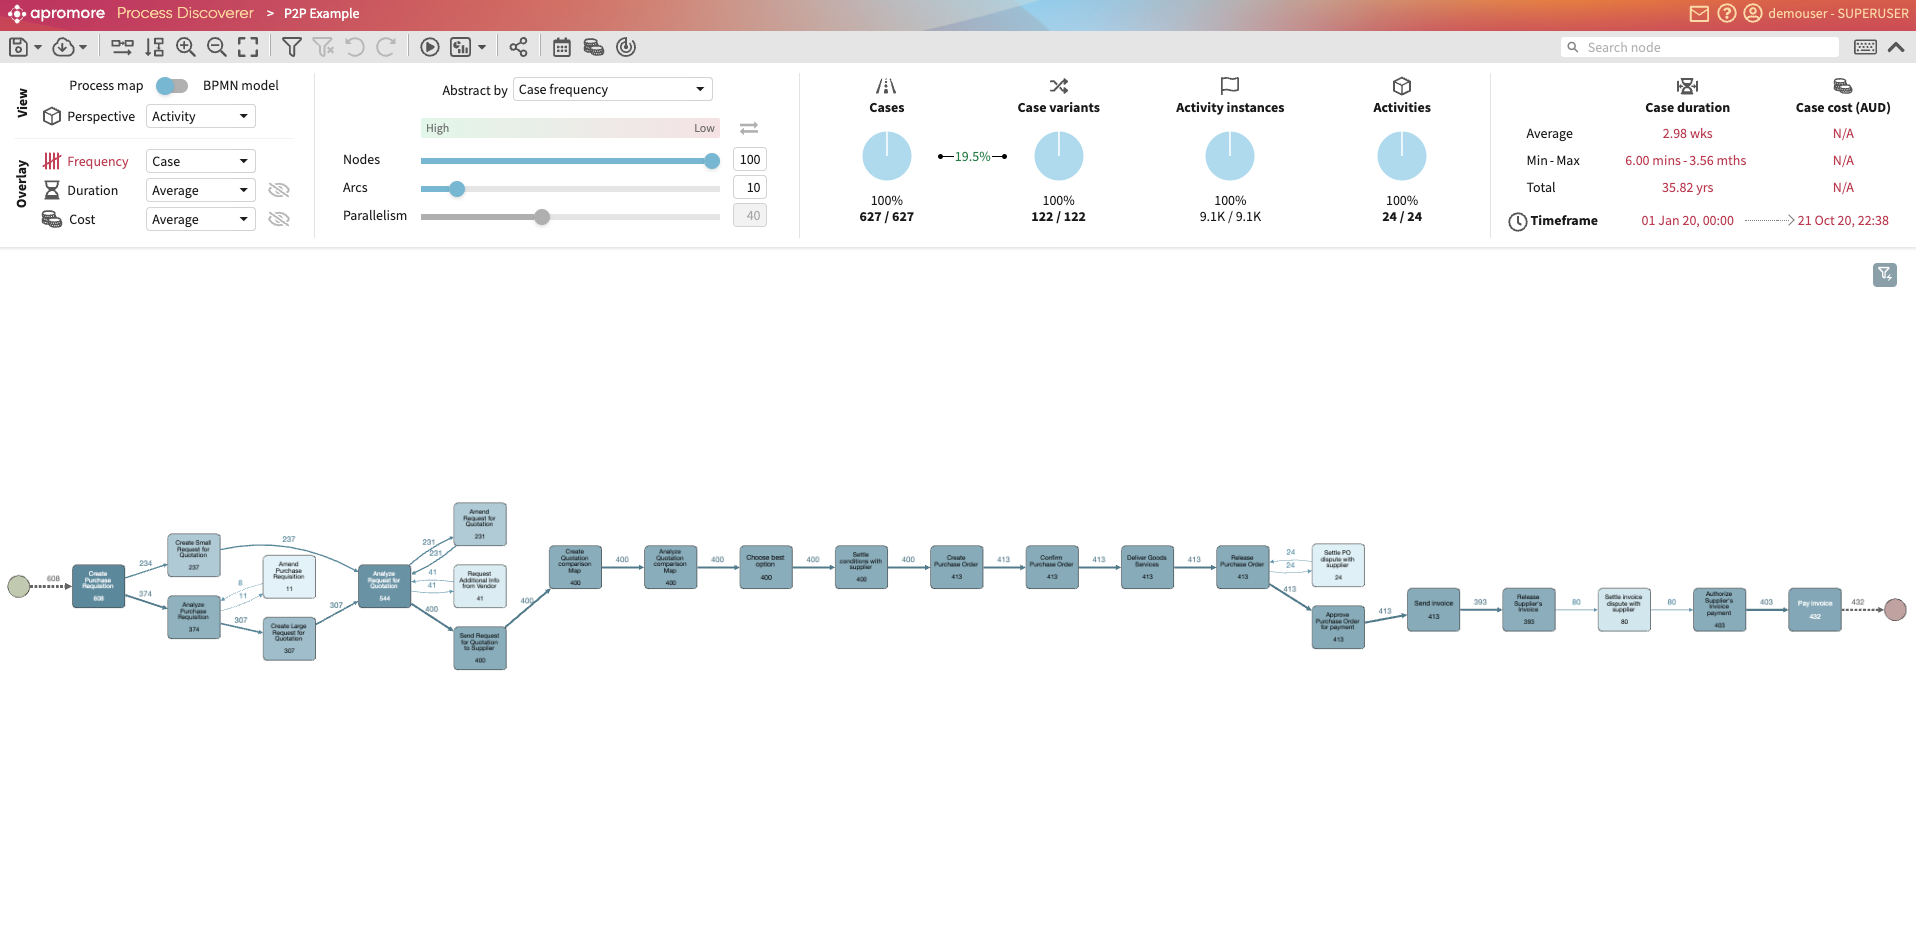
By default, Process discoverer displays the event log as a process map.
The process map is abstracted to display a certain percentage of nodes and arcs. A node is an activity, role, or Resource in the process map. An arc, on the other hand, indicates the direction of the next node or decision point.
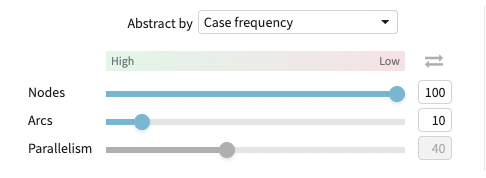
In the Abstract by section, we can use the sliders to adjust the percentage of nodes/arcs that are displayed.
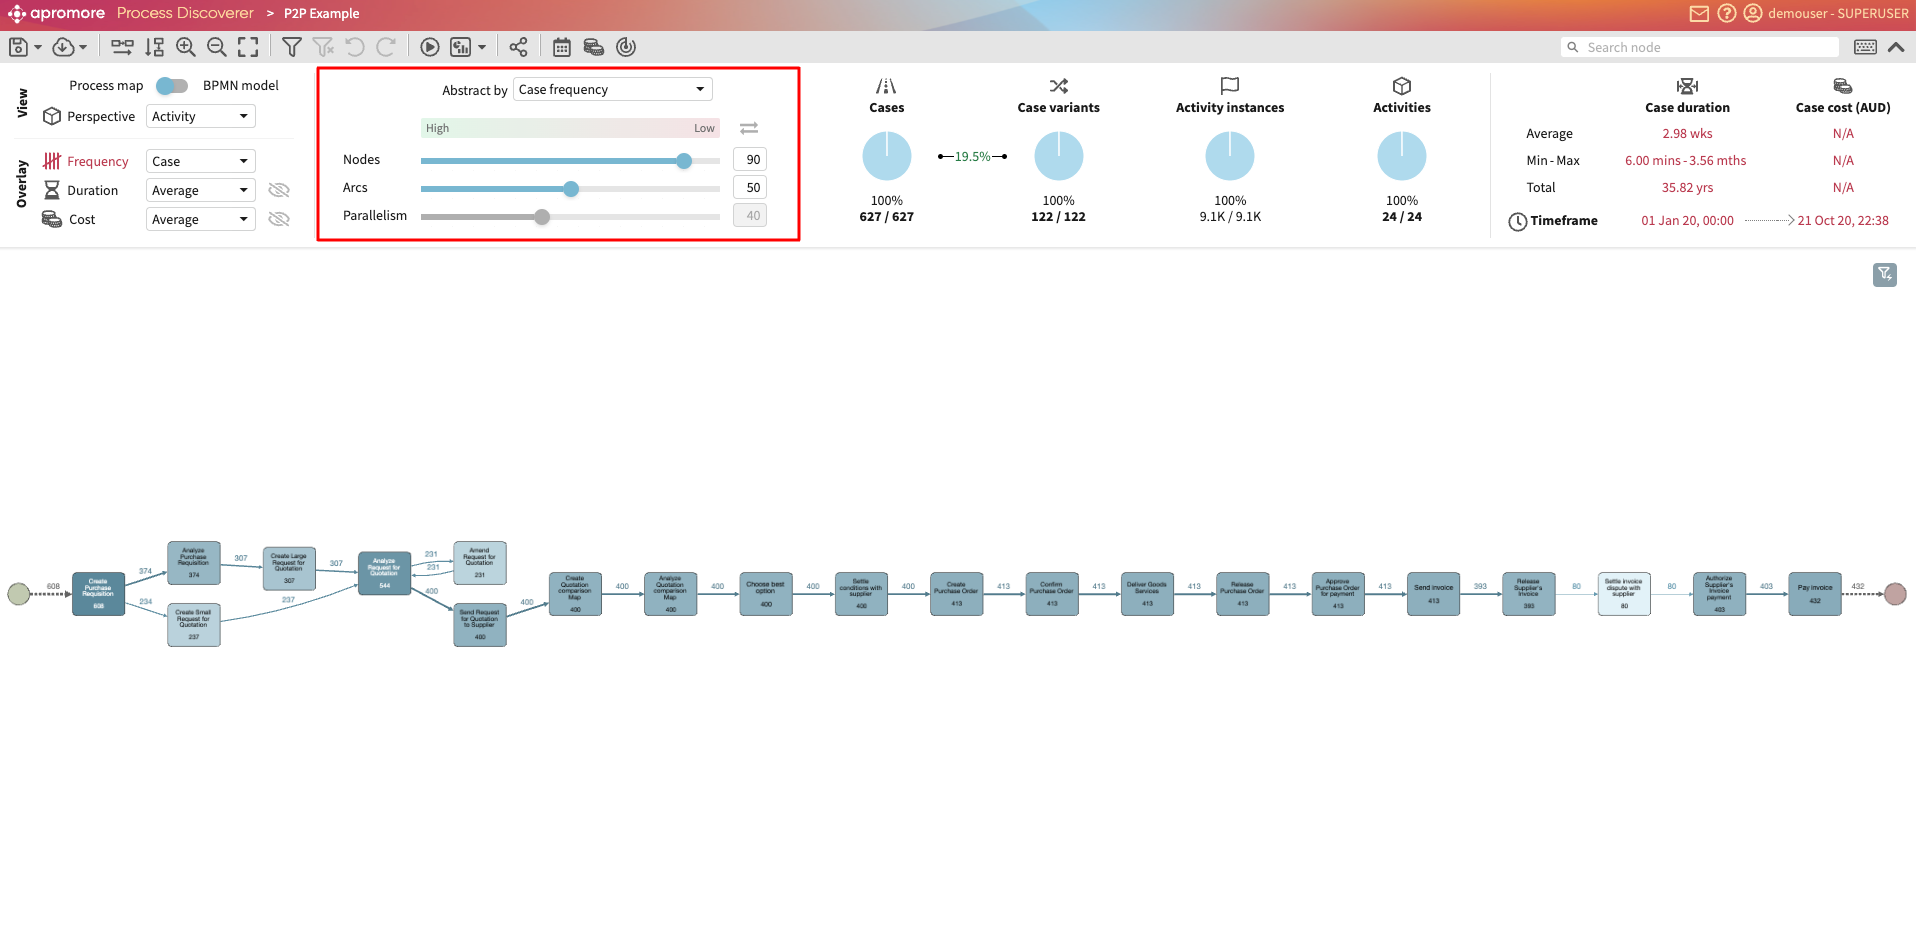
When the slider is placed at 90 for Nodes and 50 for Arcs, 90% of the nodes and 50% of the arcs will be displayed.
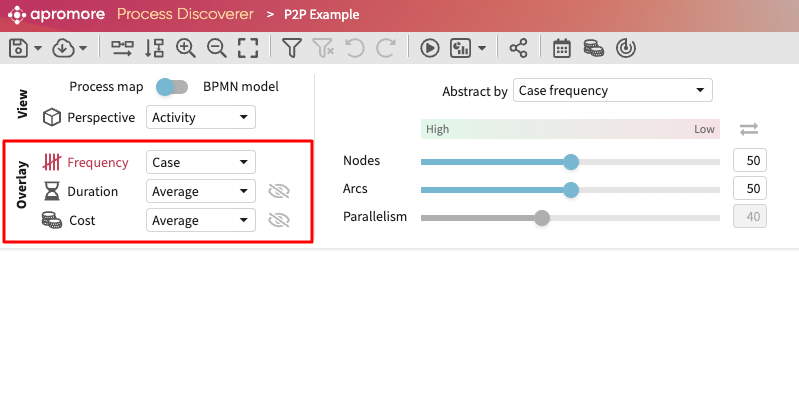
By default, Process discoverer displays the case frequency on every node and arc. The case frequency is the number of cases where the activity of the arc appears at least once. We can change what Process discoverer displays in the Overlay section.
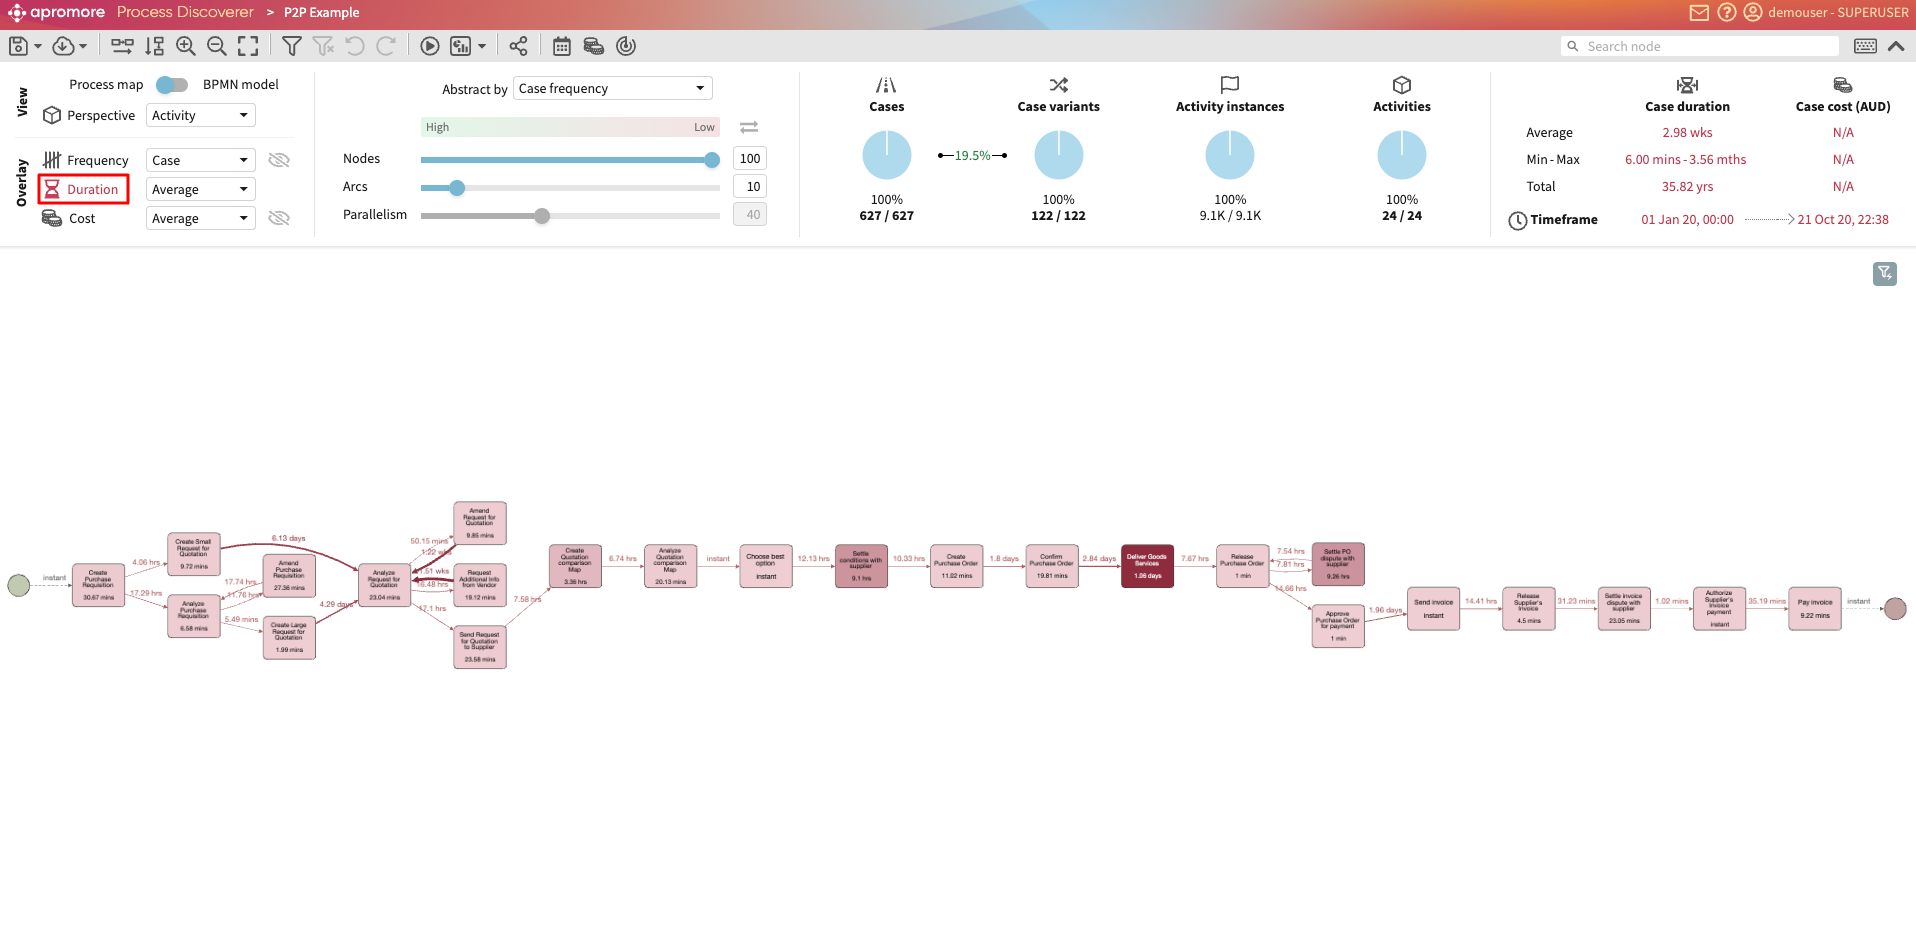
Click Duration to display the average duration for each activity in the cases.
Similarly, we can click the Cost to display the average cost for each activity in the cases.
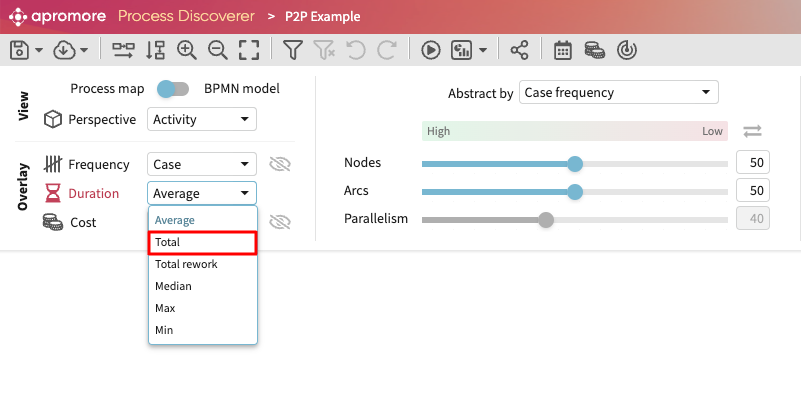
We can also change the frequency, duration, or cost metric to be displayed. For instance, if we wish to display the total duration instead of the average duration, click the dropdown and select Total.
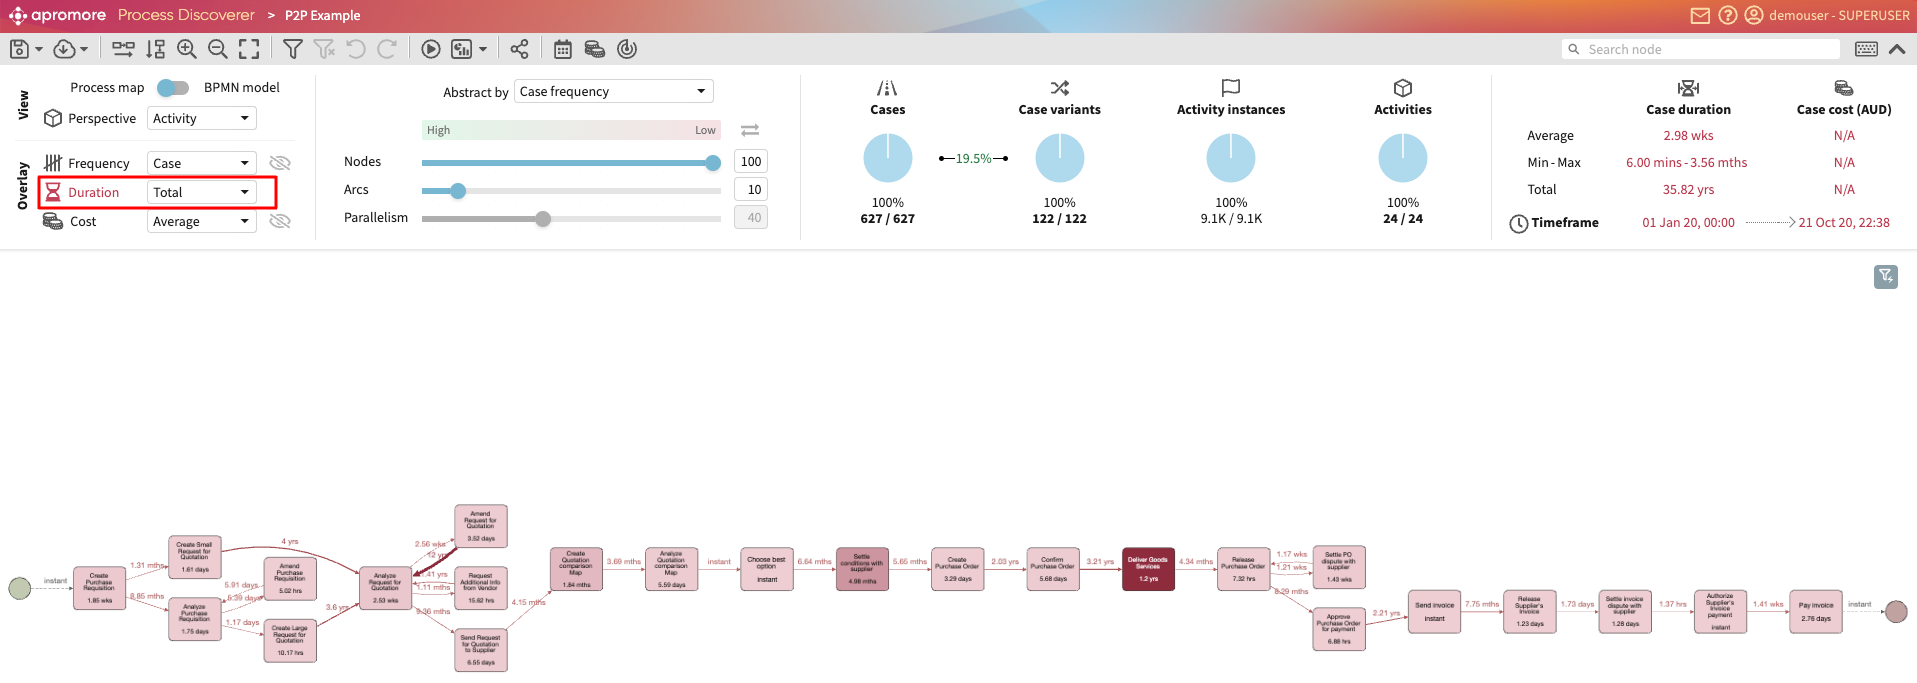
Process Discover now displays the total duration for each activity.
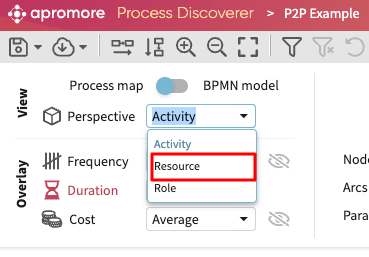
By default, the event log is displayed based on the Activity perspective. This means that the process map displays the activities in the cases. We can change the perspective to Resource. Click the Perspective dropdown in the View section and select Resource.
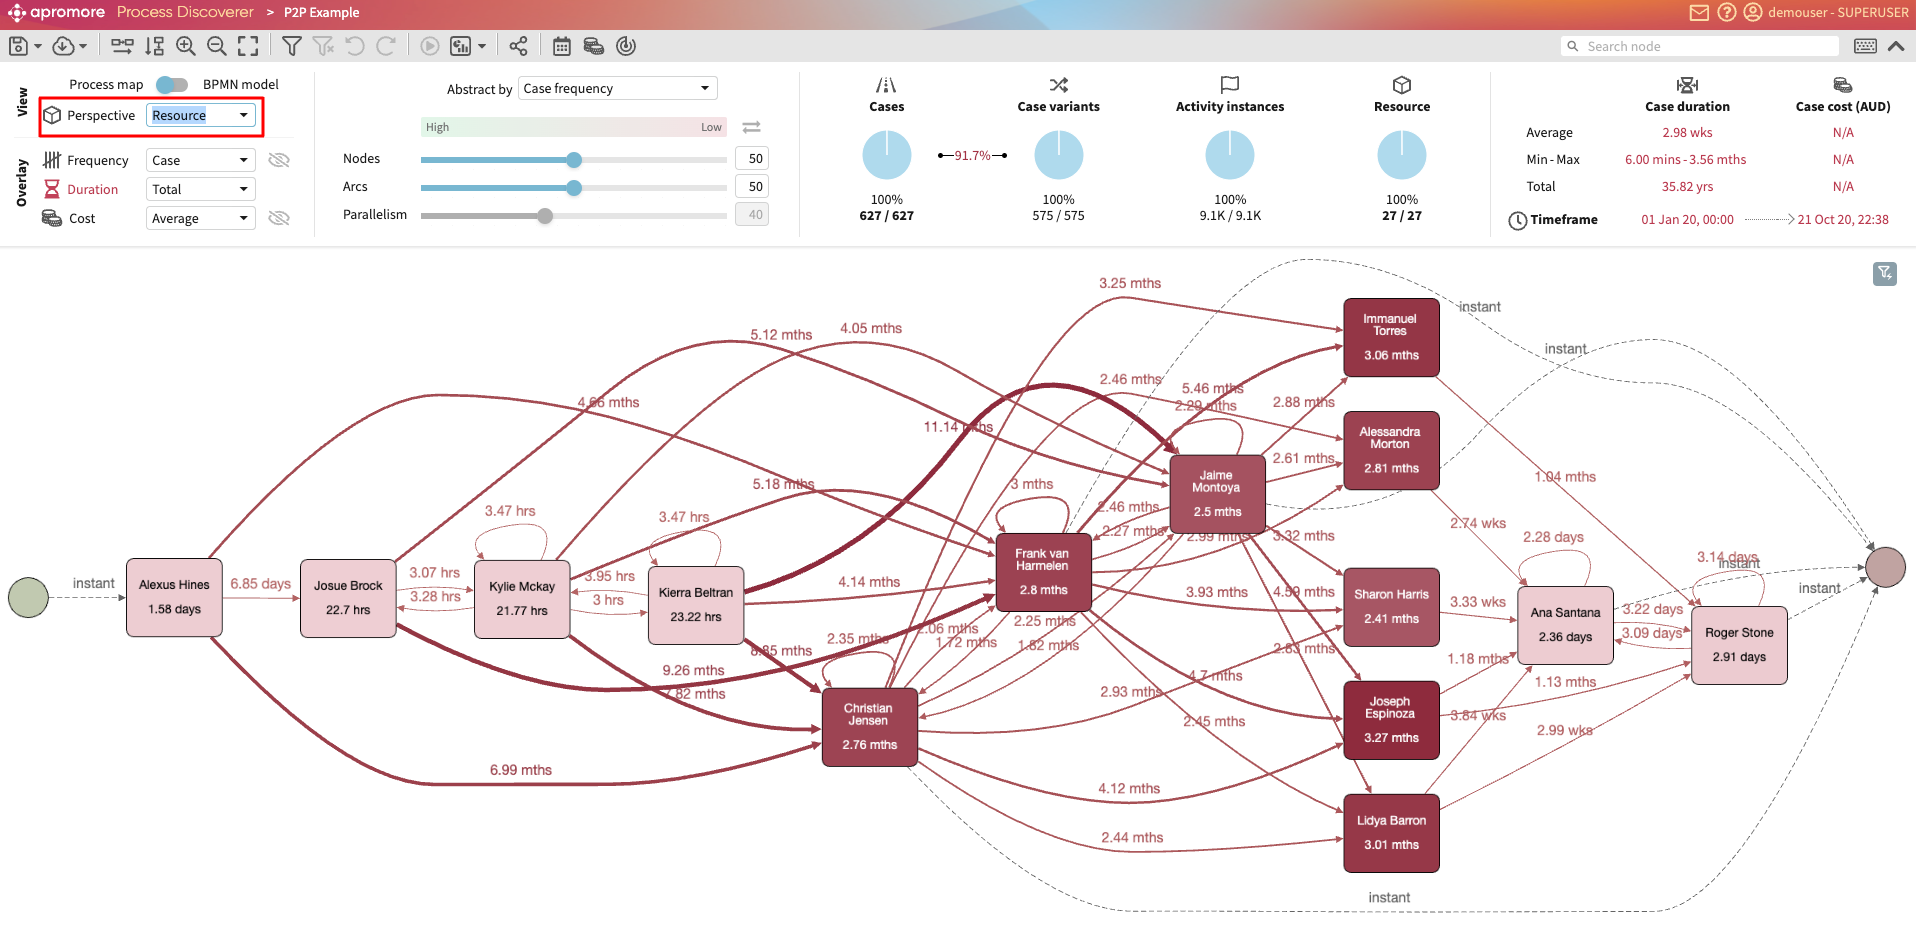
The process map now displays the resources in the cases.
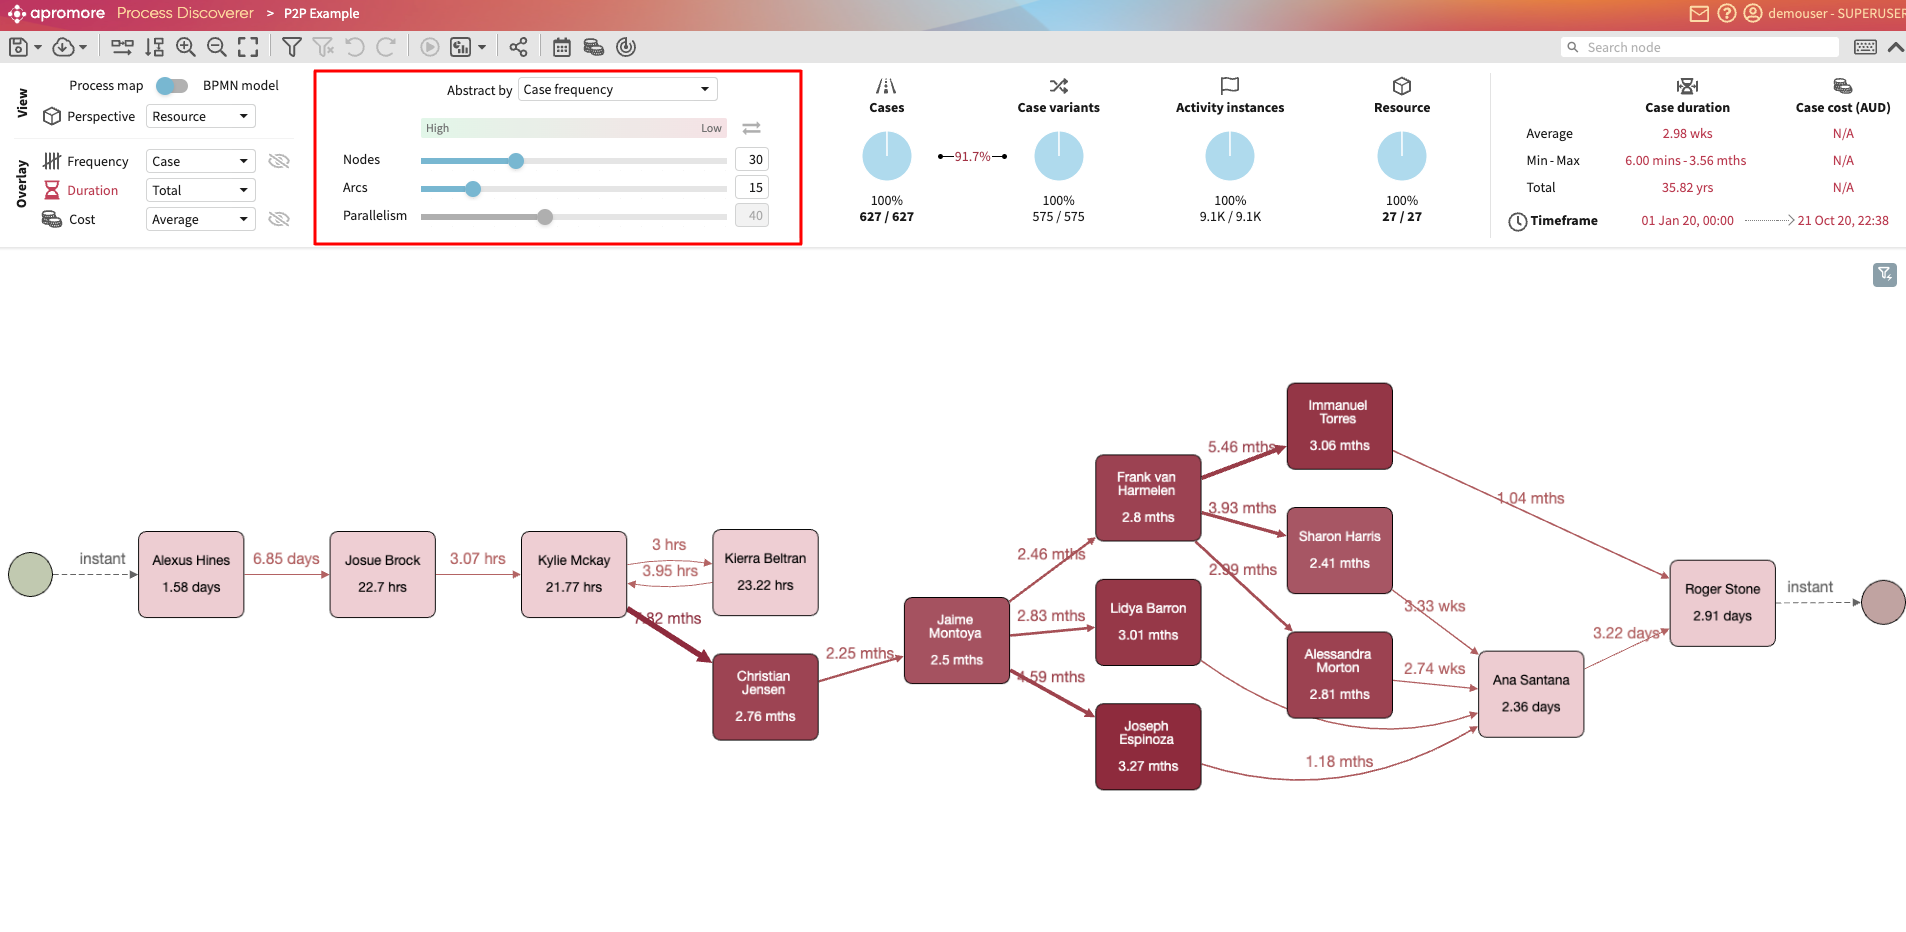
We can adjust the sliders to increase or decrease the percentage of arcs and nodes displayed.
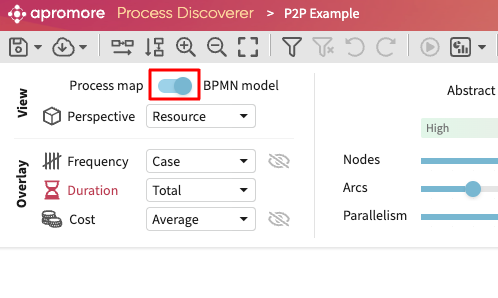
By default, Process discoverer displays a process map. We can, however, discover a BPMN model instead of the default process map. The BPMN model uses events, tasks and gateways to describe the process flow.
To display the BPMN model in Process discoverer, toggle on the BPMN model in the View section.
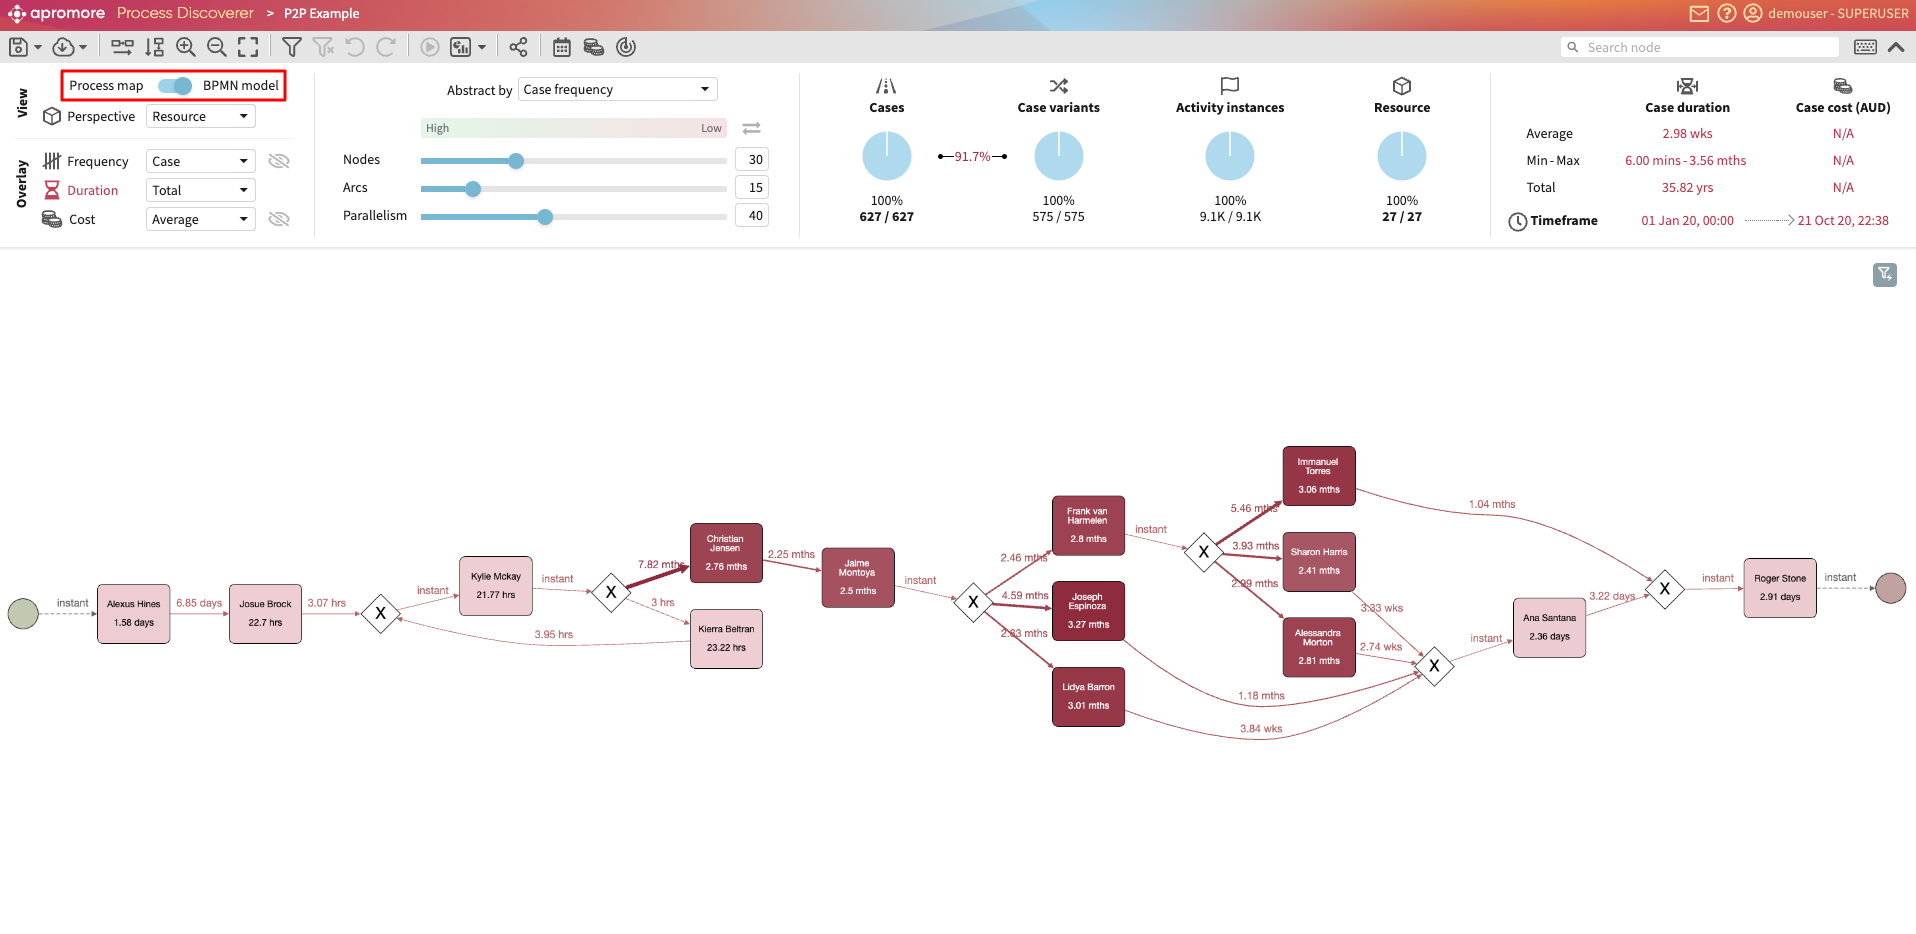
The discovered BPMN model is now displayed.
Drill down with filters
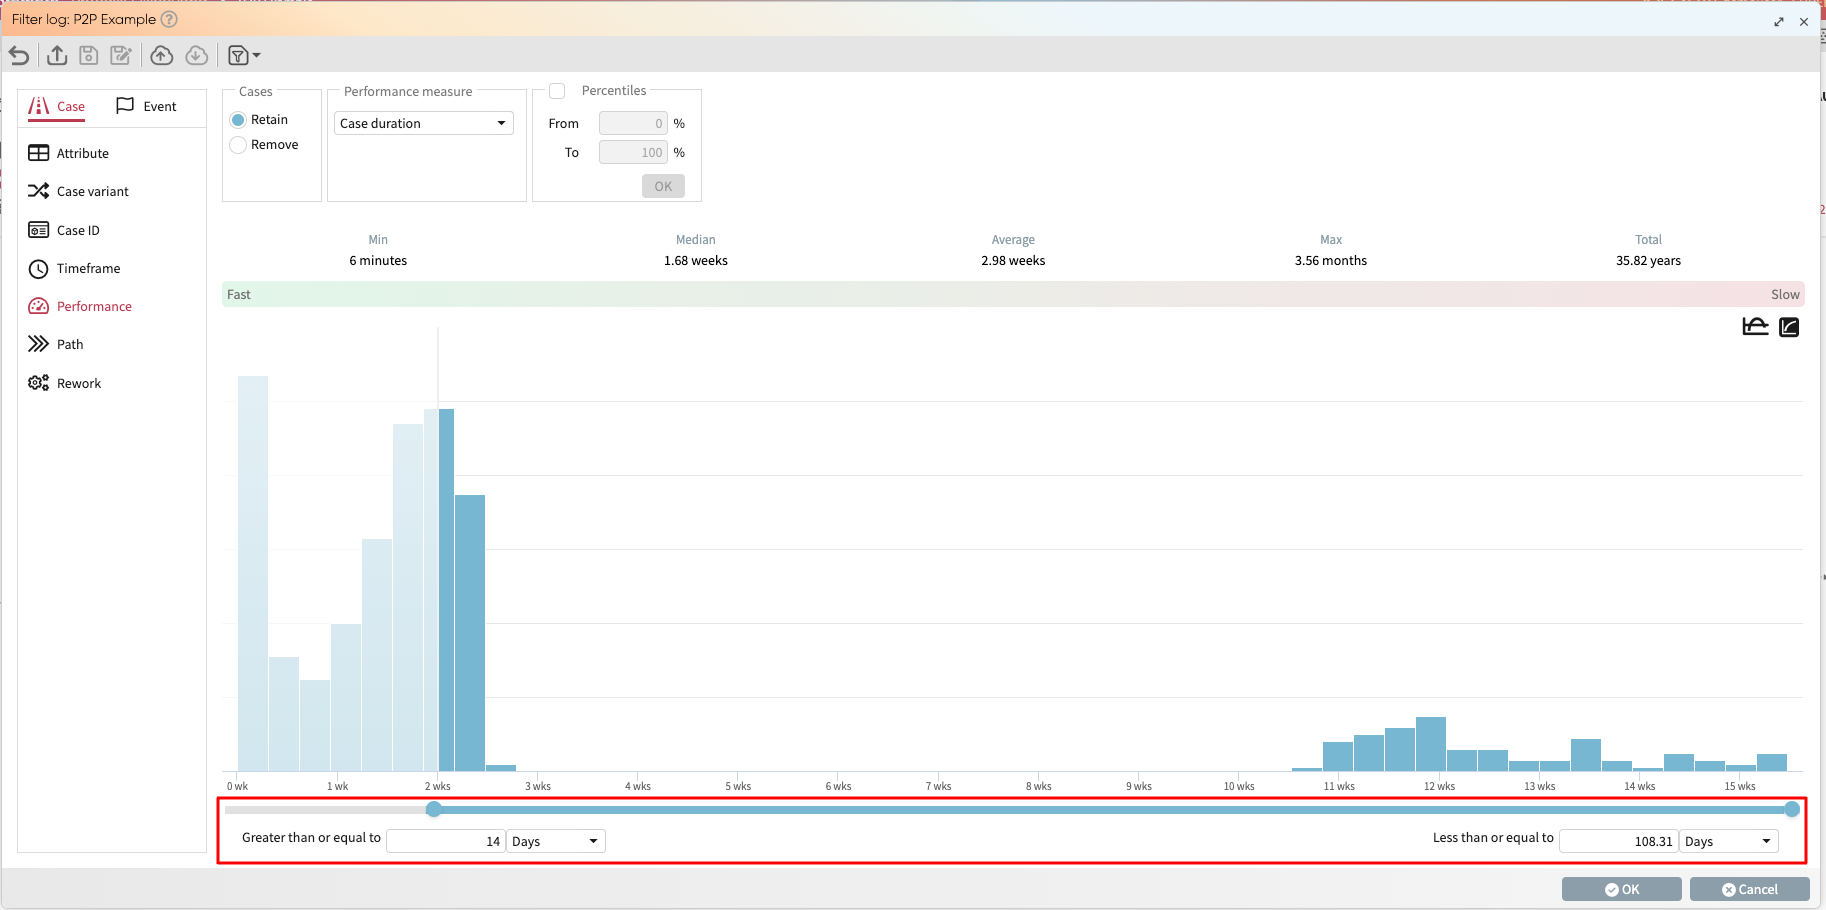
We can focus on a specific subset of cases using filters. For instance, we can retain cases that take more than 14 days with the Performance filter.
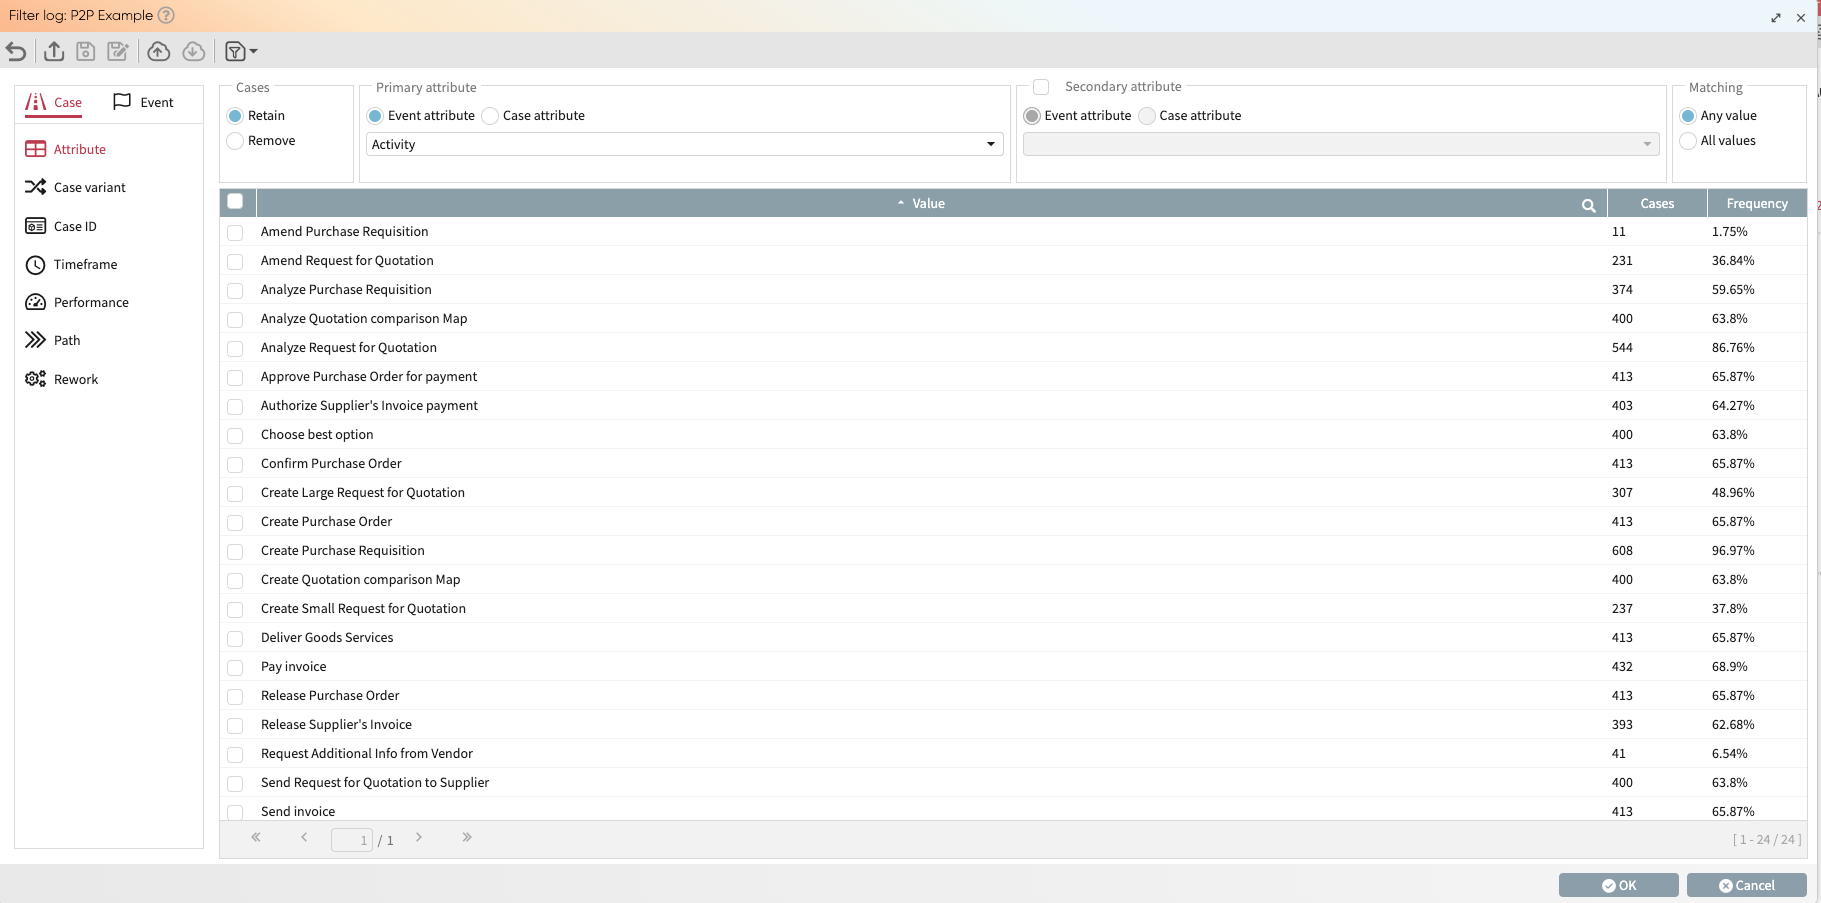
In Process discoverer, click the Filter icon 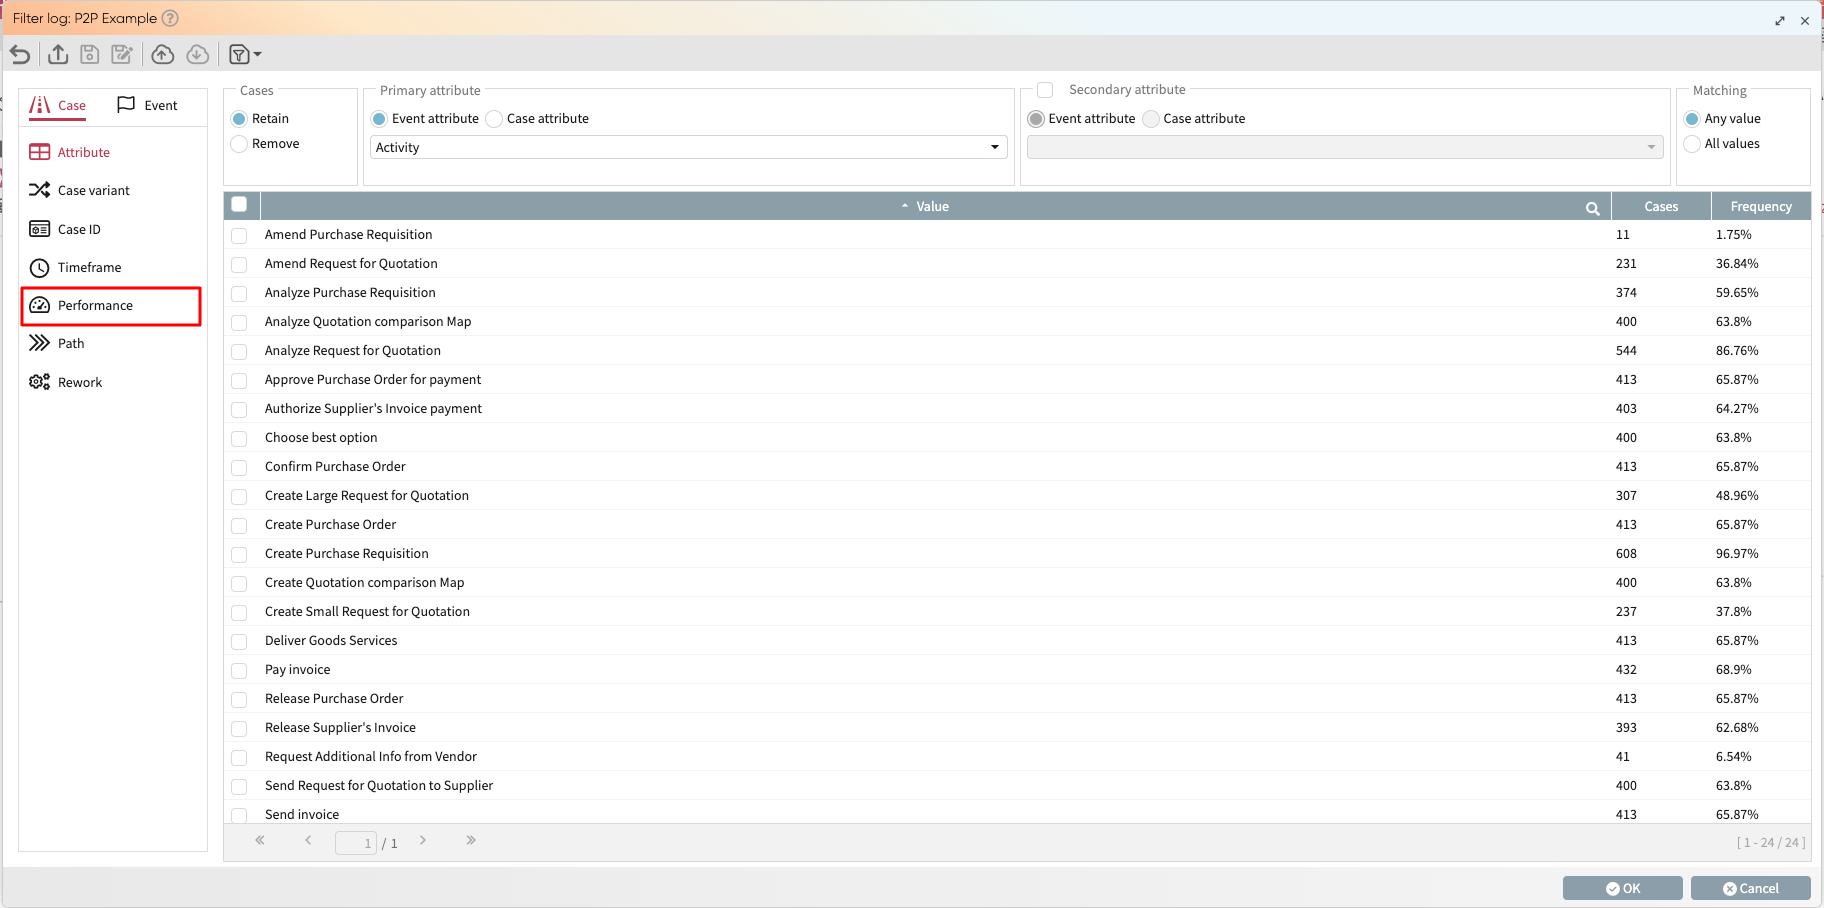 .
This opens the Filter log window.
.
This opens the Filter log window.
Click Performance.
To retain cases that take more than 14 days, use the slider below to specify the 14-day range or enter 14 in the text box.
Click OK to apply the filter. Process discoverer now displays only cases that took more than 14 days.
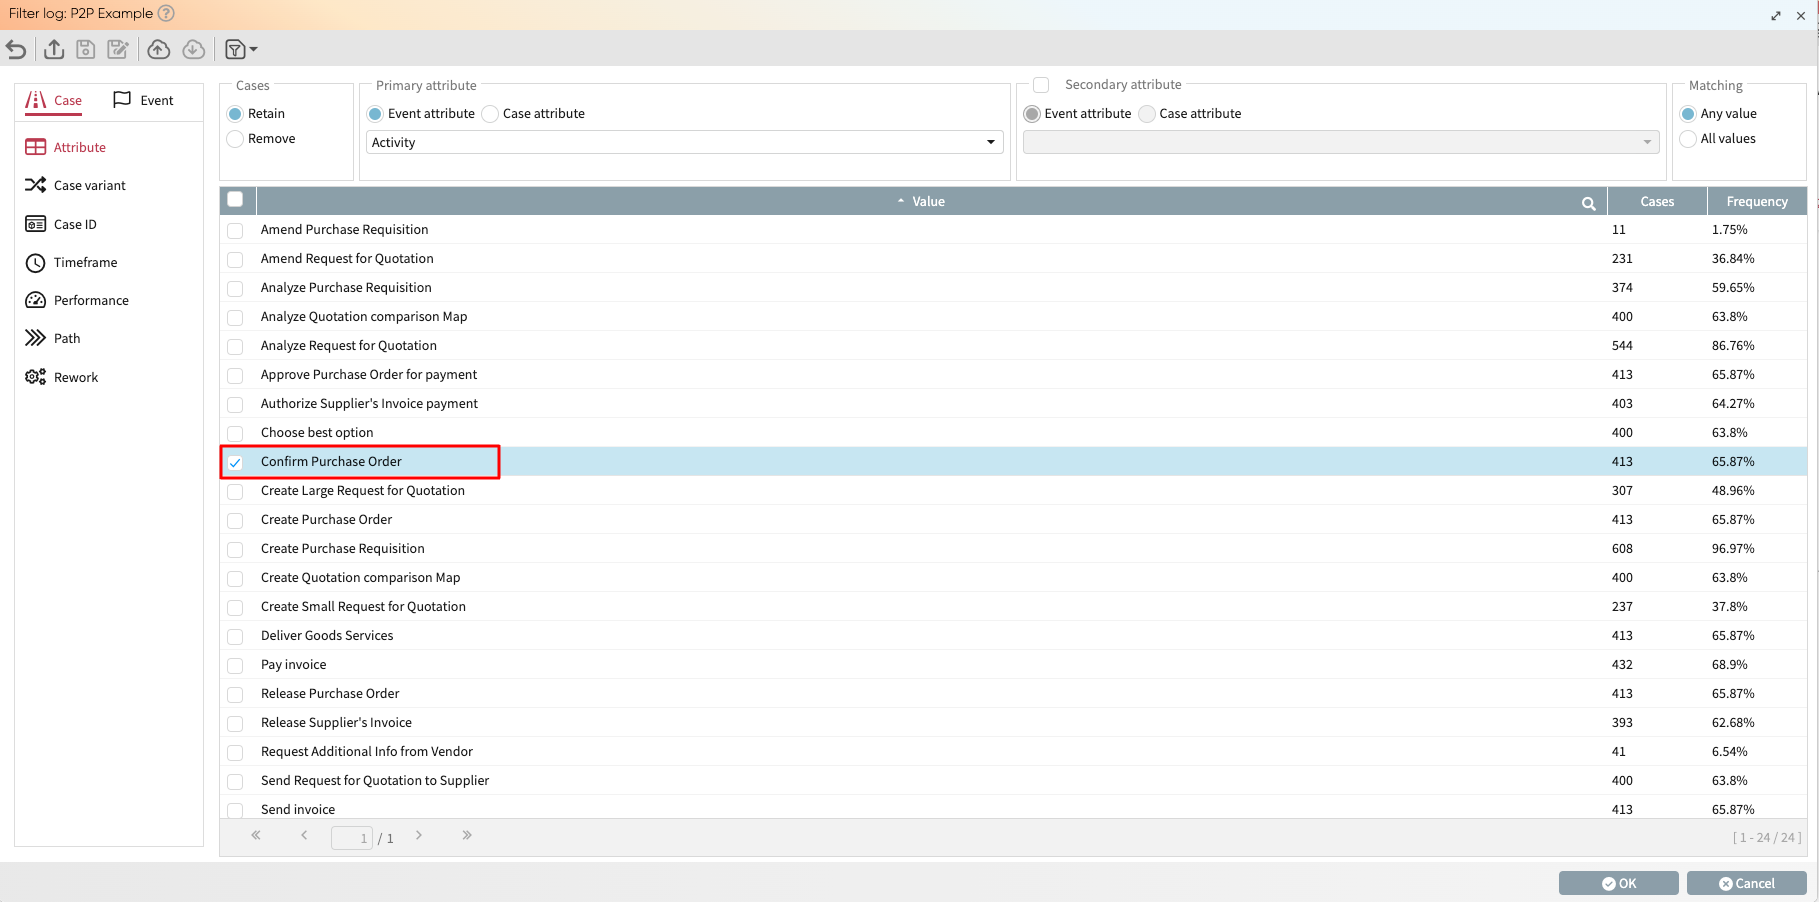
We can also use the attribute filter to retain cases the activity “Confirm Purchase Order” occurs. In the Filter log window, click Attribute and select “Confirm Purchase Order”.
Click OK to apply the filter. Process discoverer now displays cases where the “Confirm Purchase Order” activity was present.
Launch a Dashboard
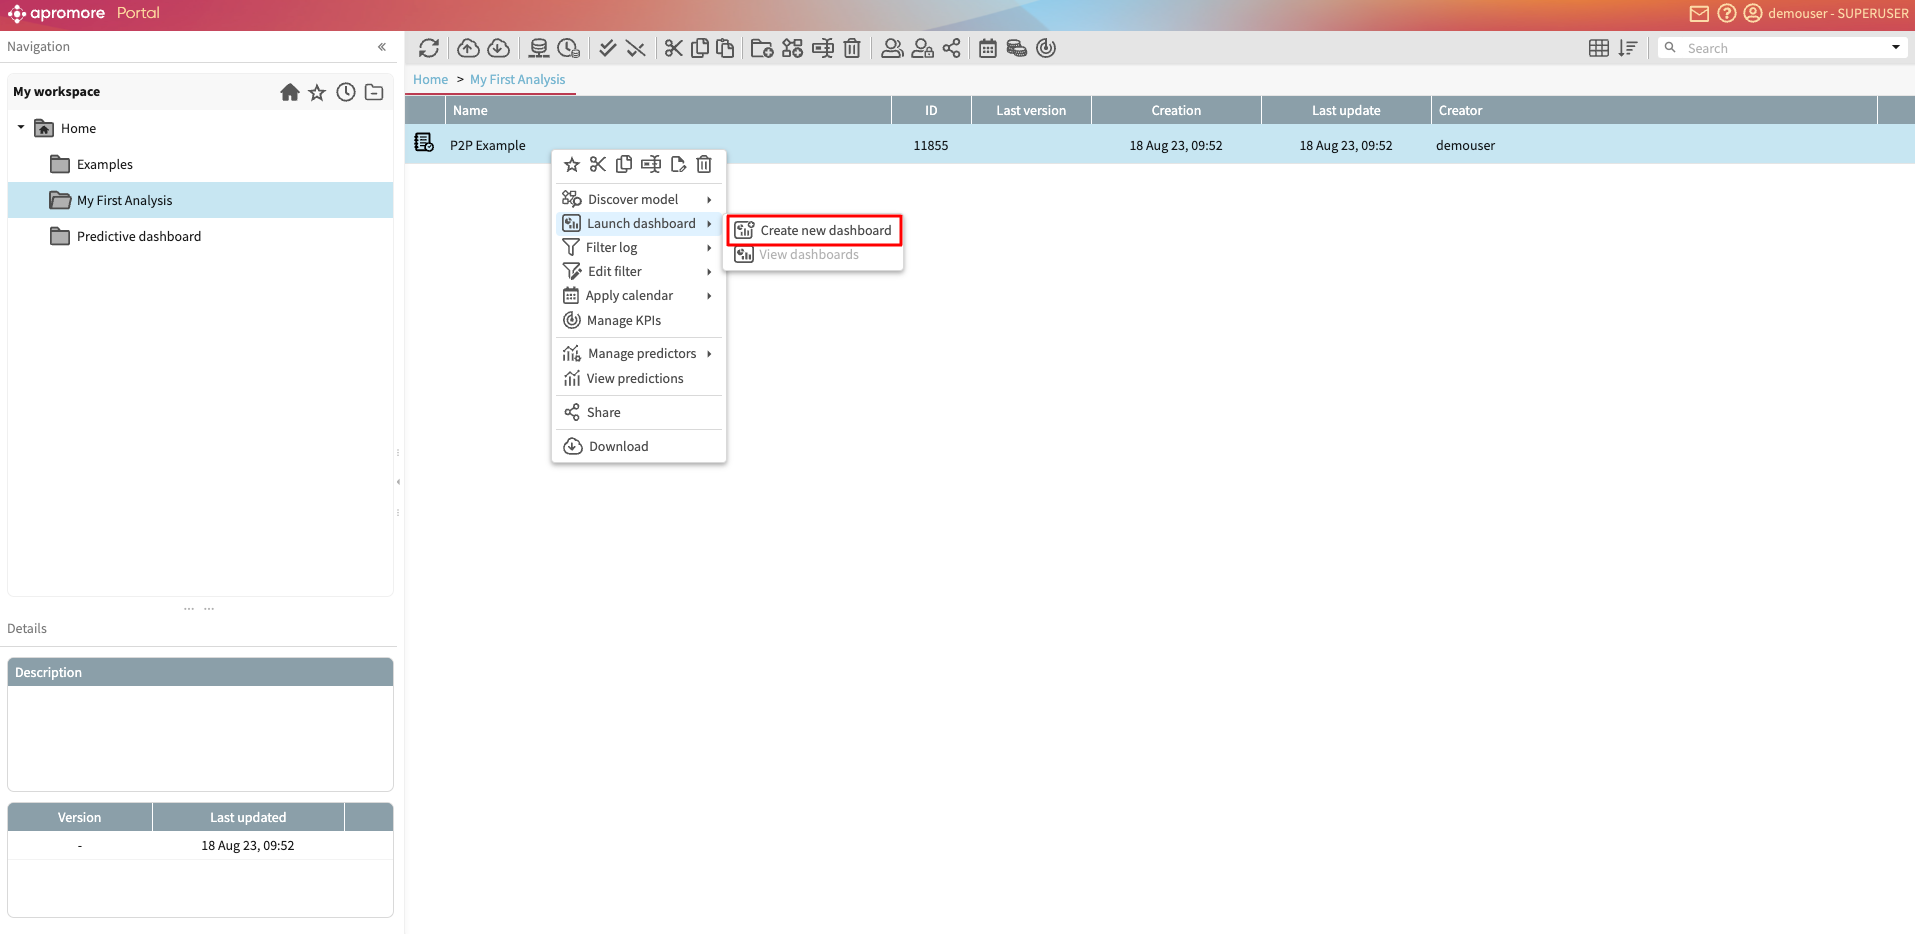
Apromore dashboard allows us to explore the event log and extract key statistics. From Portal, right-click on the event log and click Dashboards > New dashboard.
 Alternatively, we can select the dashboard icon from the menu
bar that appear and click New dashboard.
Alternatively, we can select the dashboard icon from the menu
bar that appear and click New dashboard.
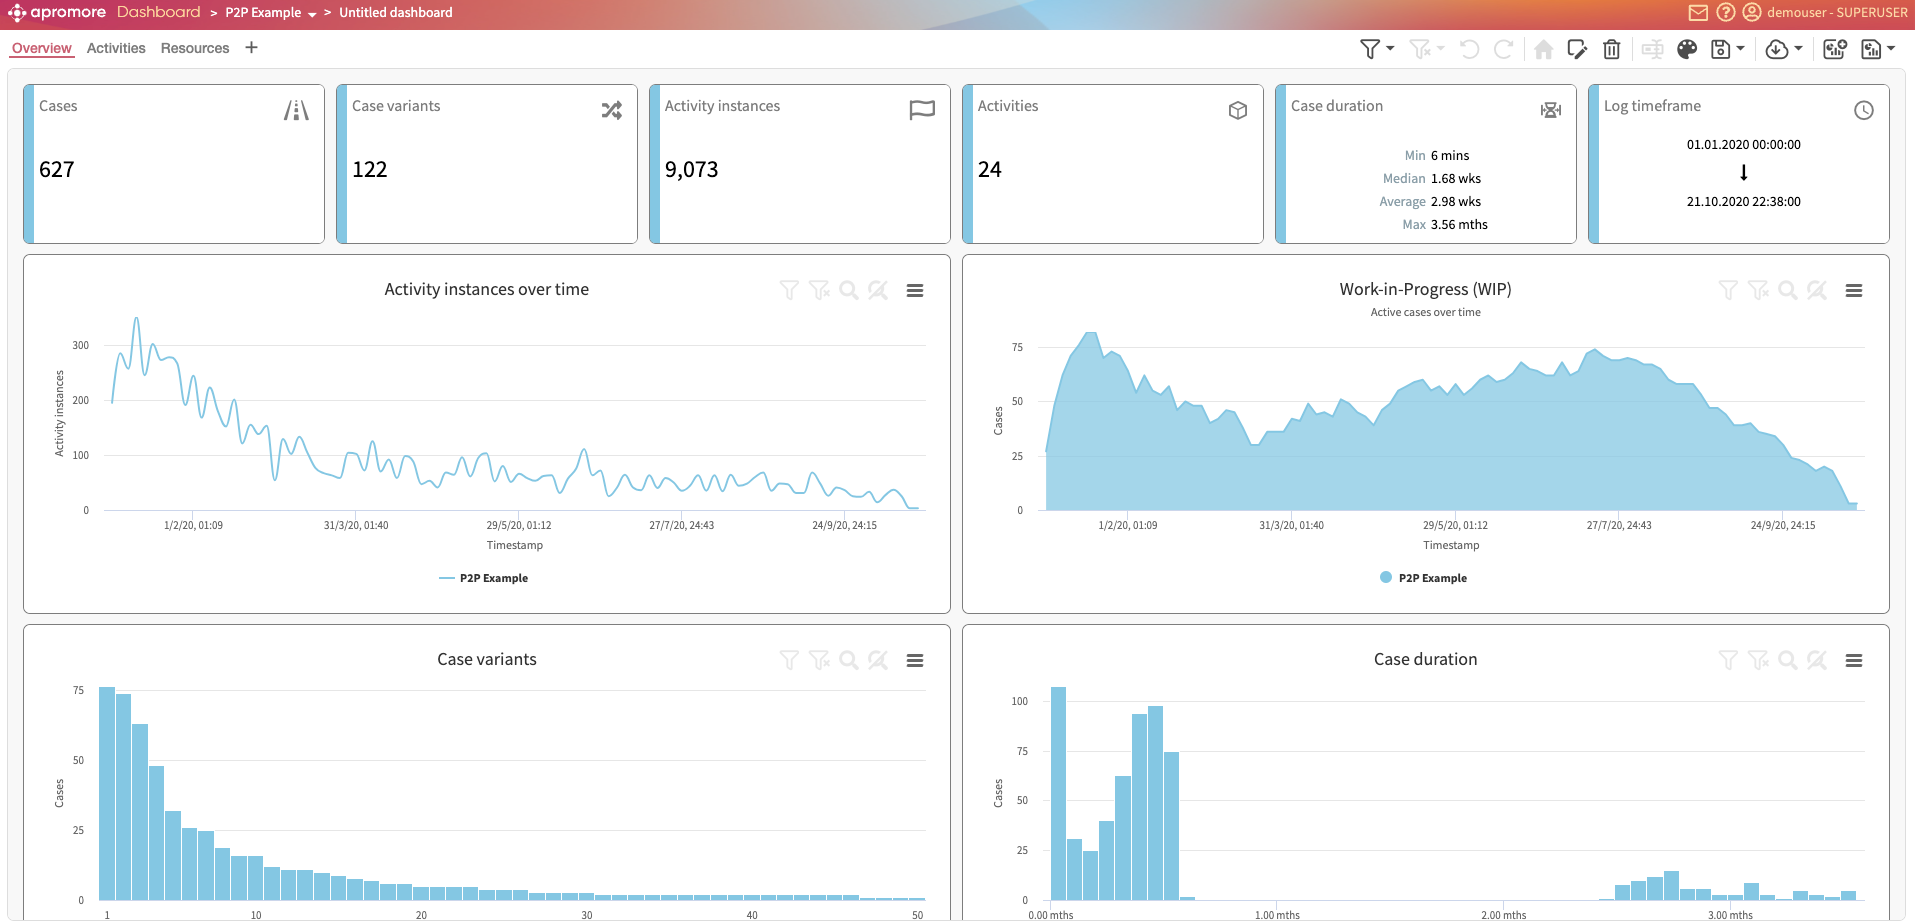
This will display Apromore default dashboard view.
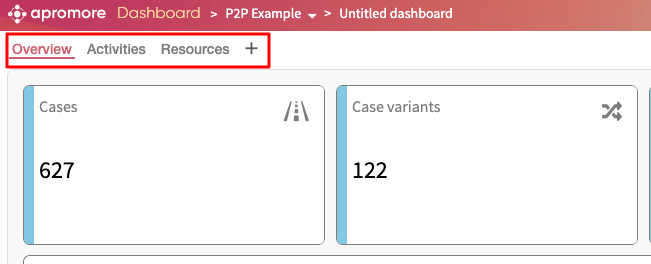
This is the Overview view. We can change to other views by switching tabs in the top left corner.
Overview: This gives statistics of all the cases in the process.
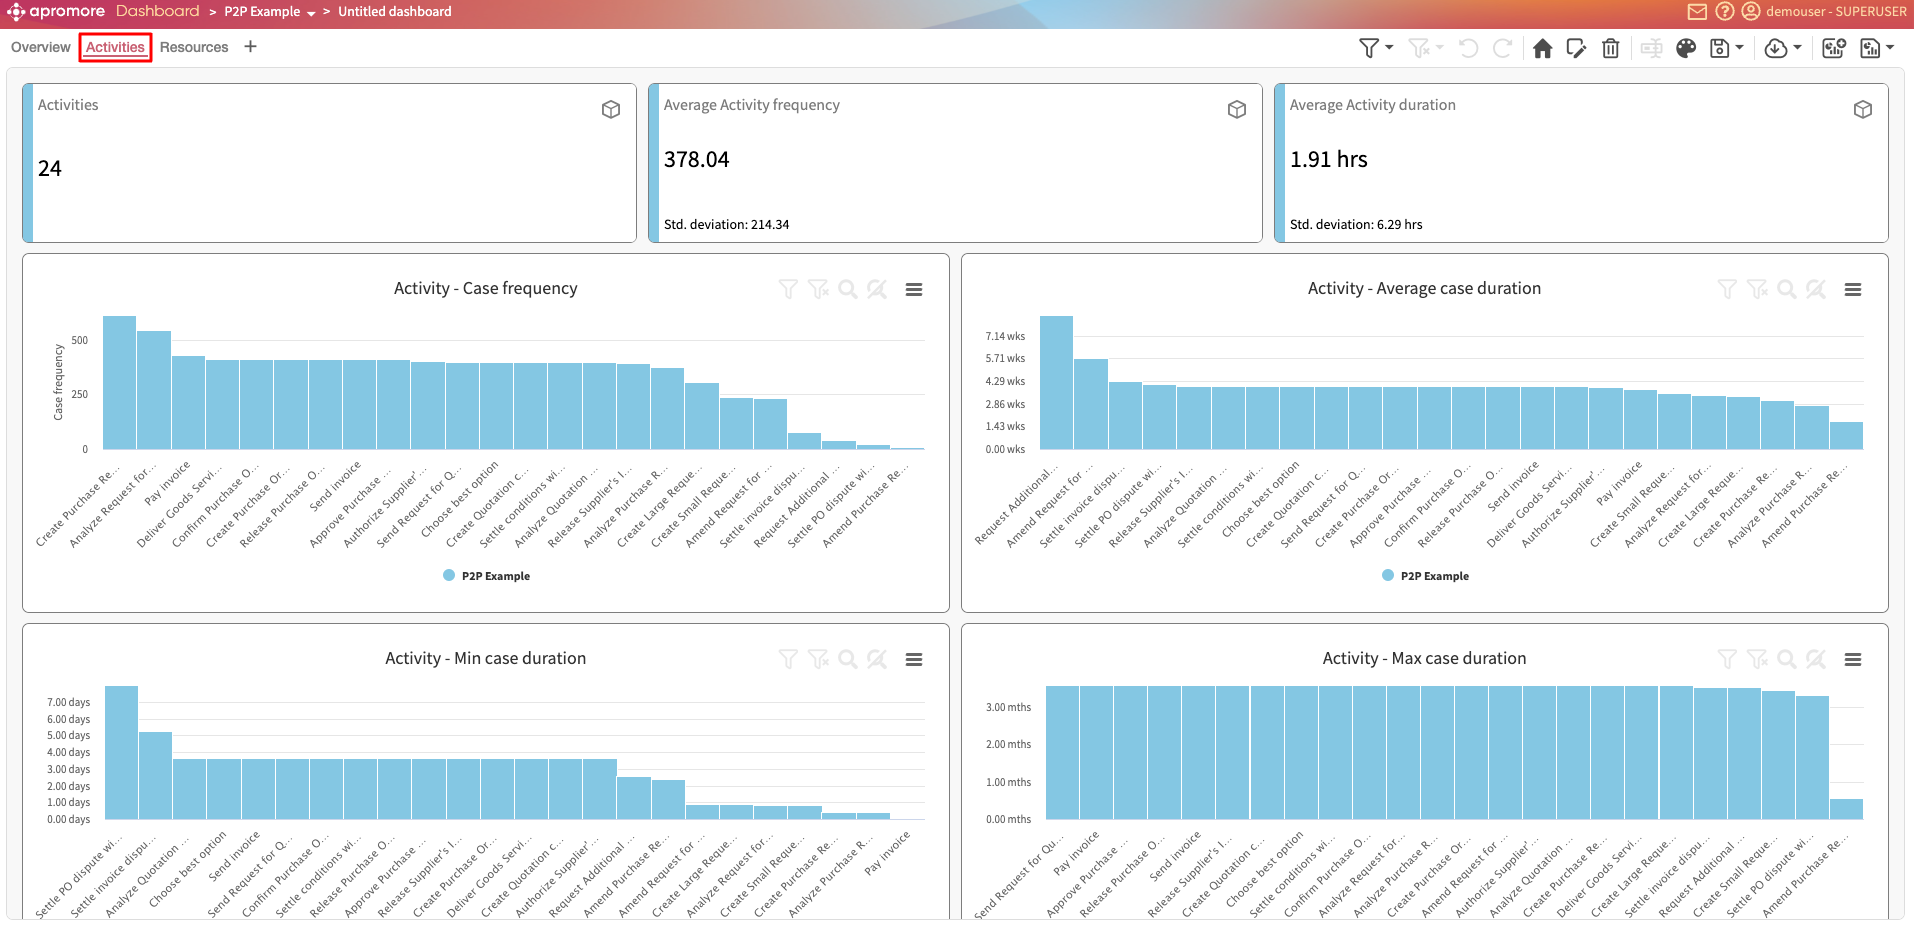
Activity: This allows us to provide statistics from the perspective of the different activities in the process. For example, what the case frequency of each activity is.
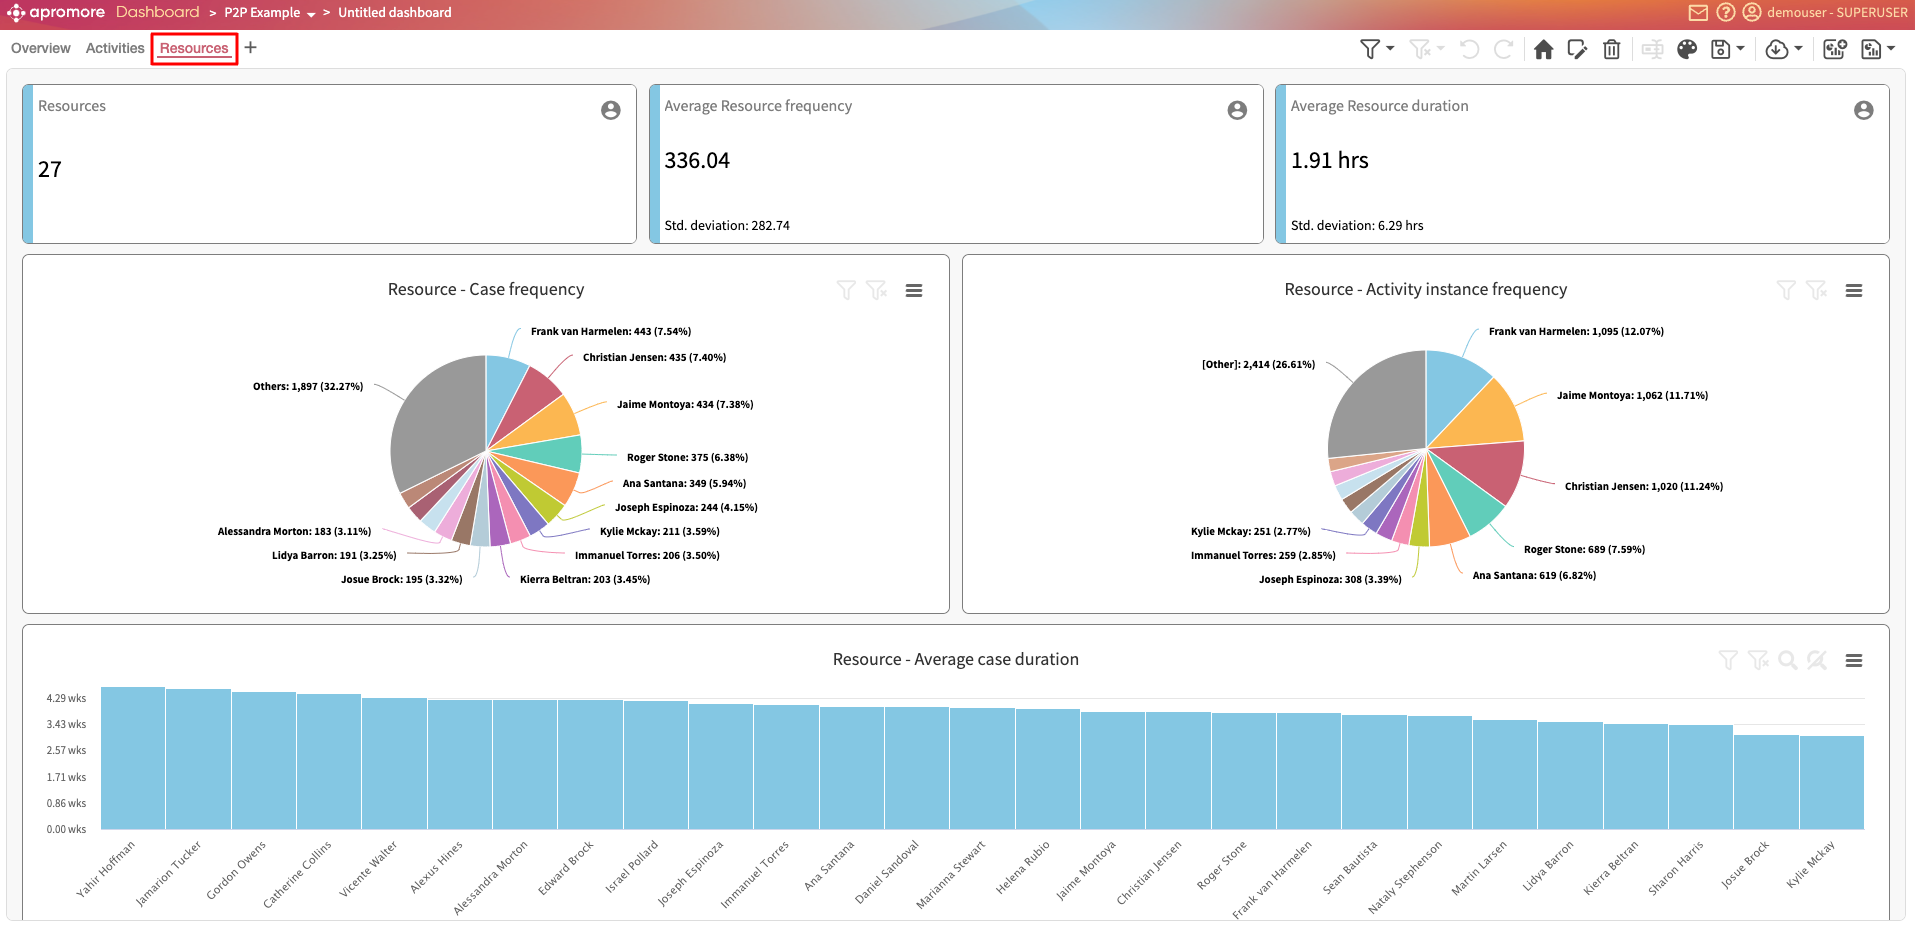
Resources: This gives information about each Resource. For example, what the case frequency for each Resource is.
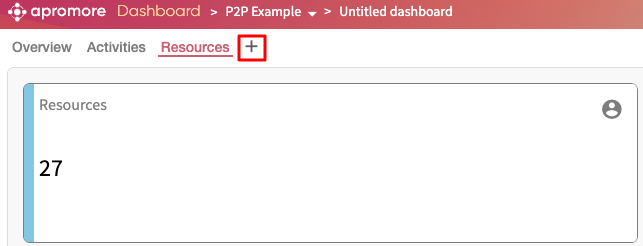
We can also create our custom view. Click “+” to add a view.
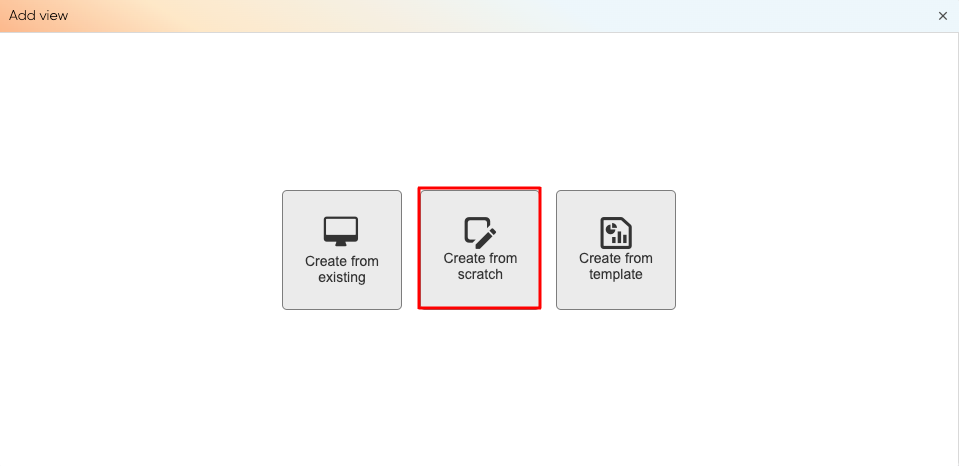
Click Create from scratch.
We can start adding charts, tables, tiles, etc, to the dashboard view.
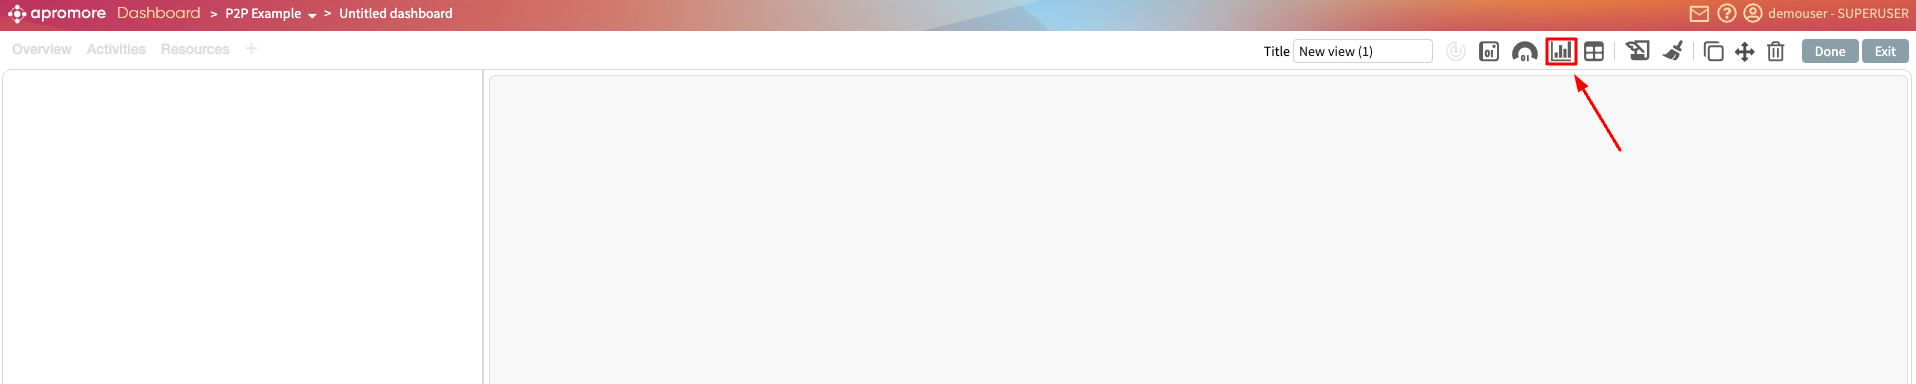
To add a new chart, for instance, click the Add new chart icon 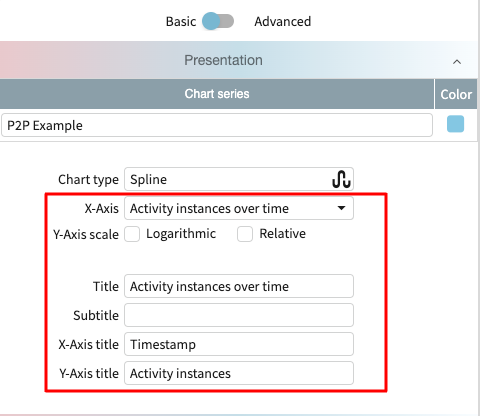
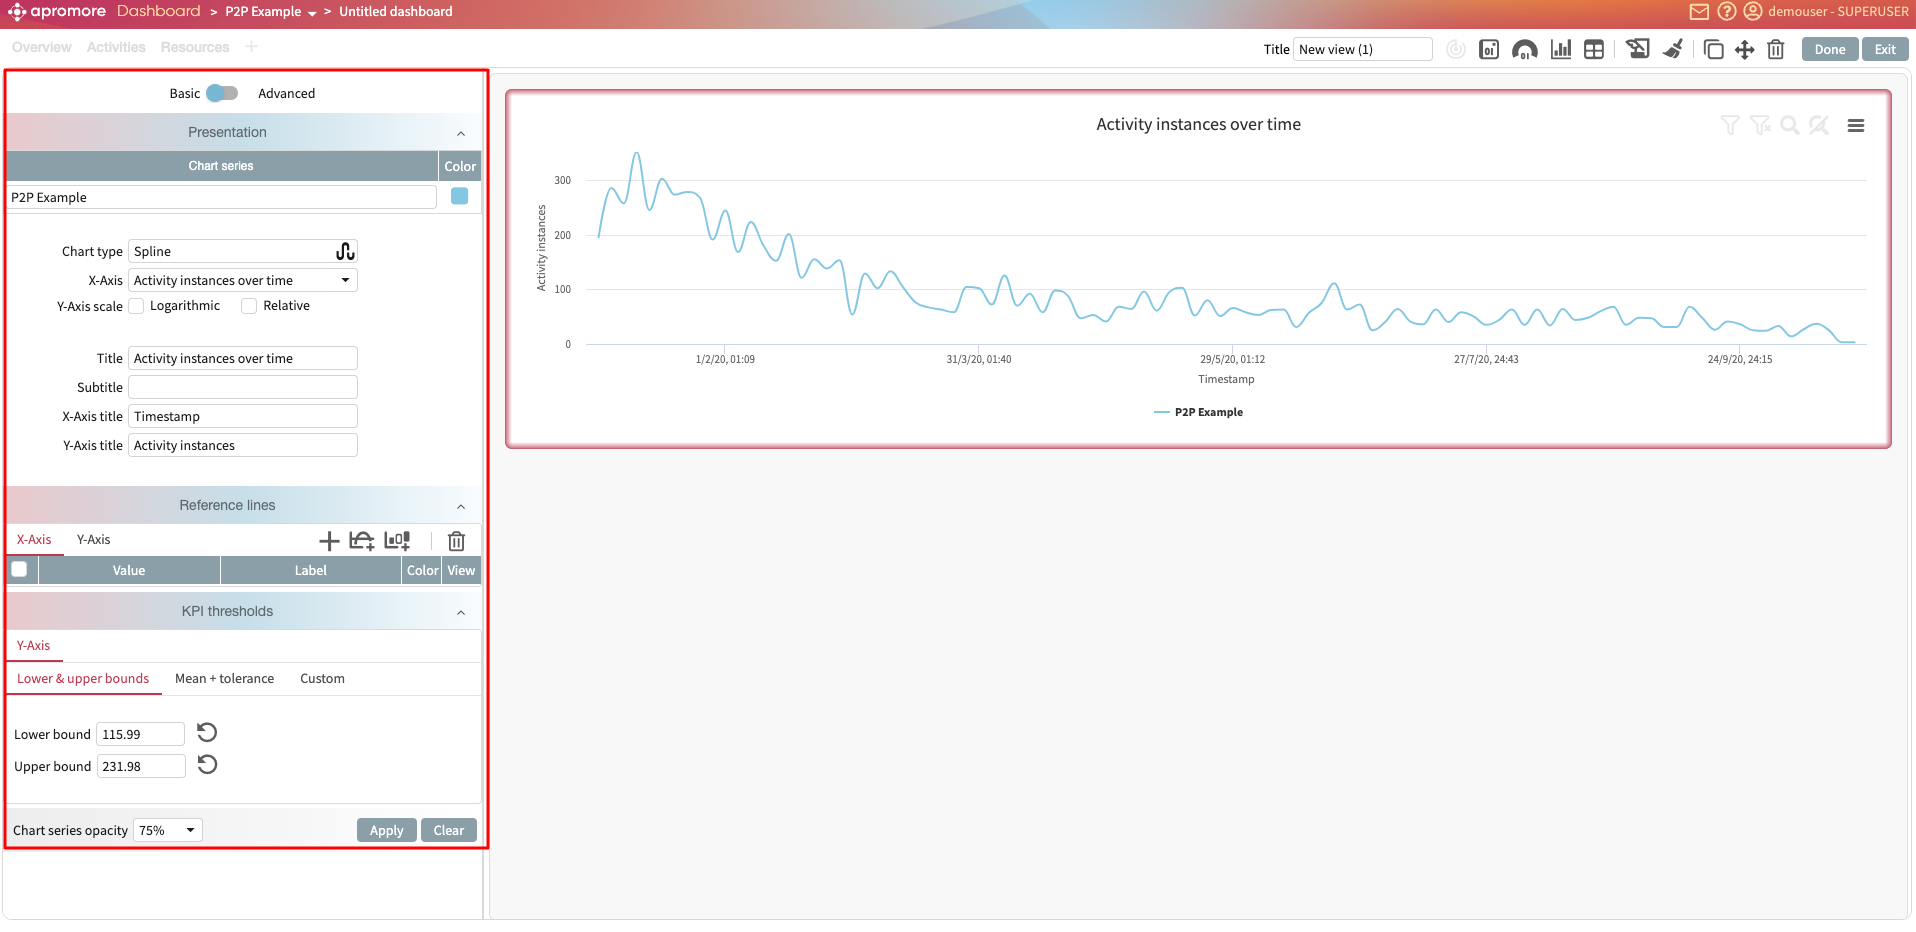
It generates a default “Activity instances over time” chart. This chart can be configured using a wide range of configurations. Click on the chart to display the configuration settings.
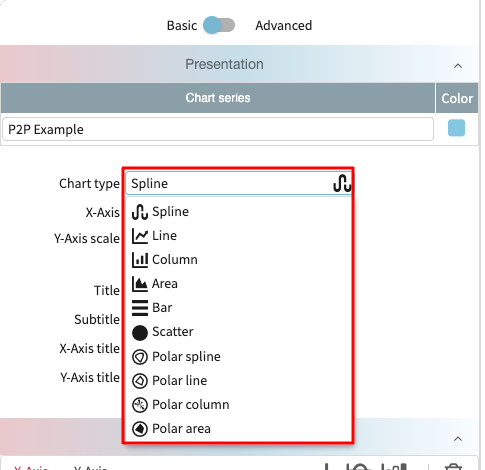
We can create line charts, column charts, area charts, bar charts, etc using the Chart type drop-down.
We can also specify the attribute or metric that should be displayed on the X-axis and Y-axis. We can change the title, subtitle and axis titles of the chart.
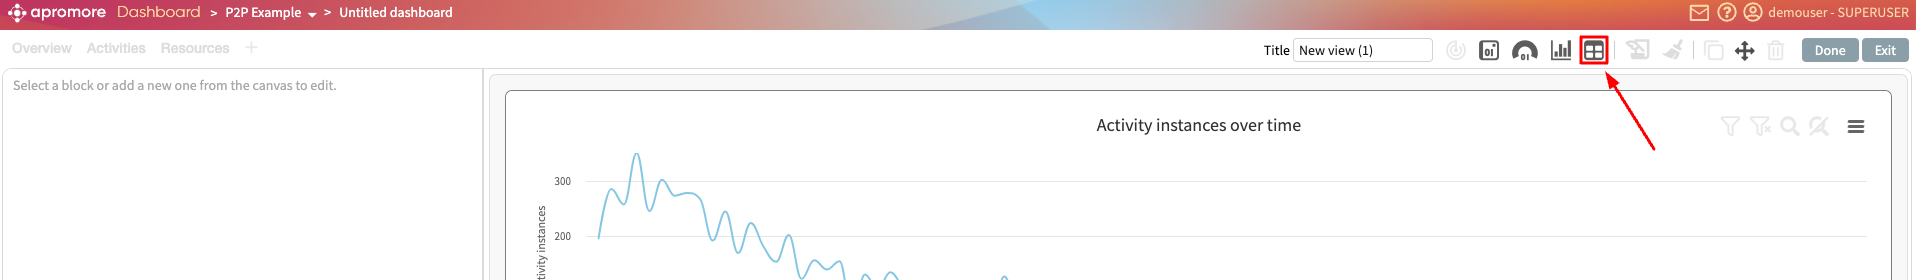
We can also add a table to the view.
Click the Add new table icon 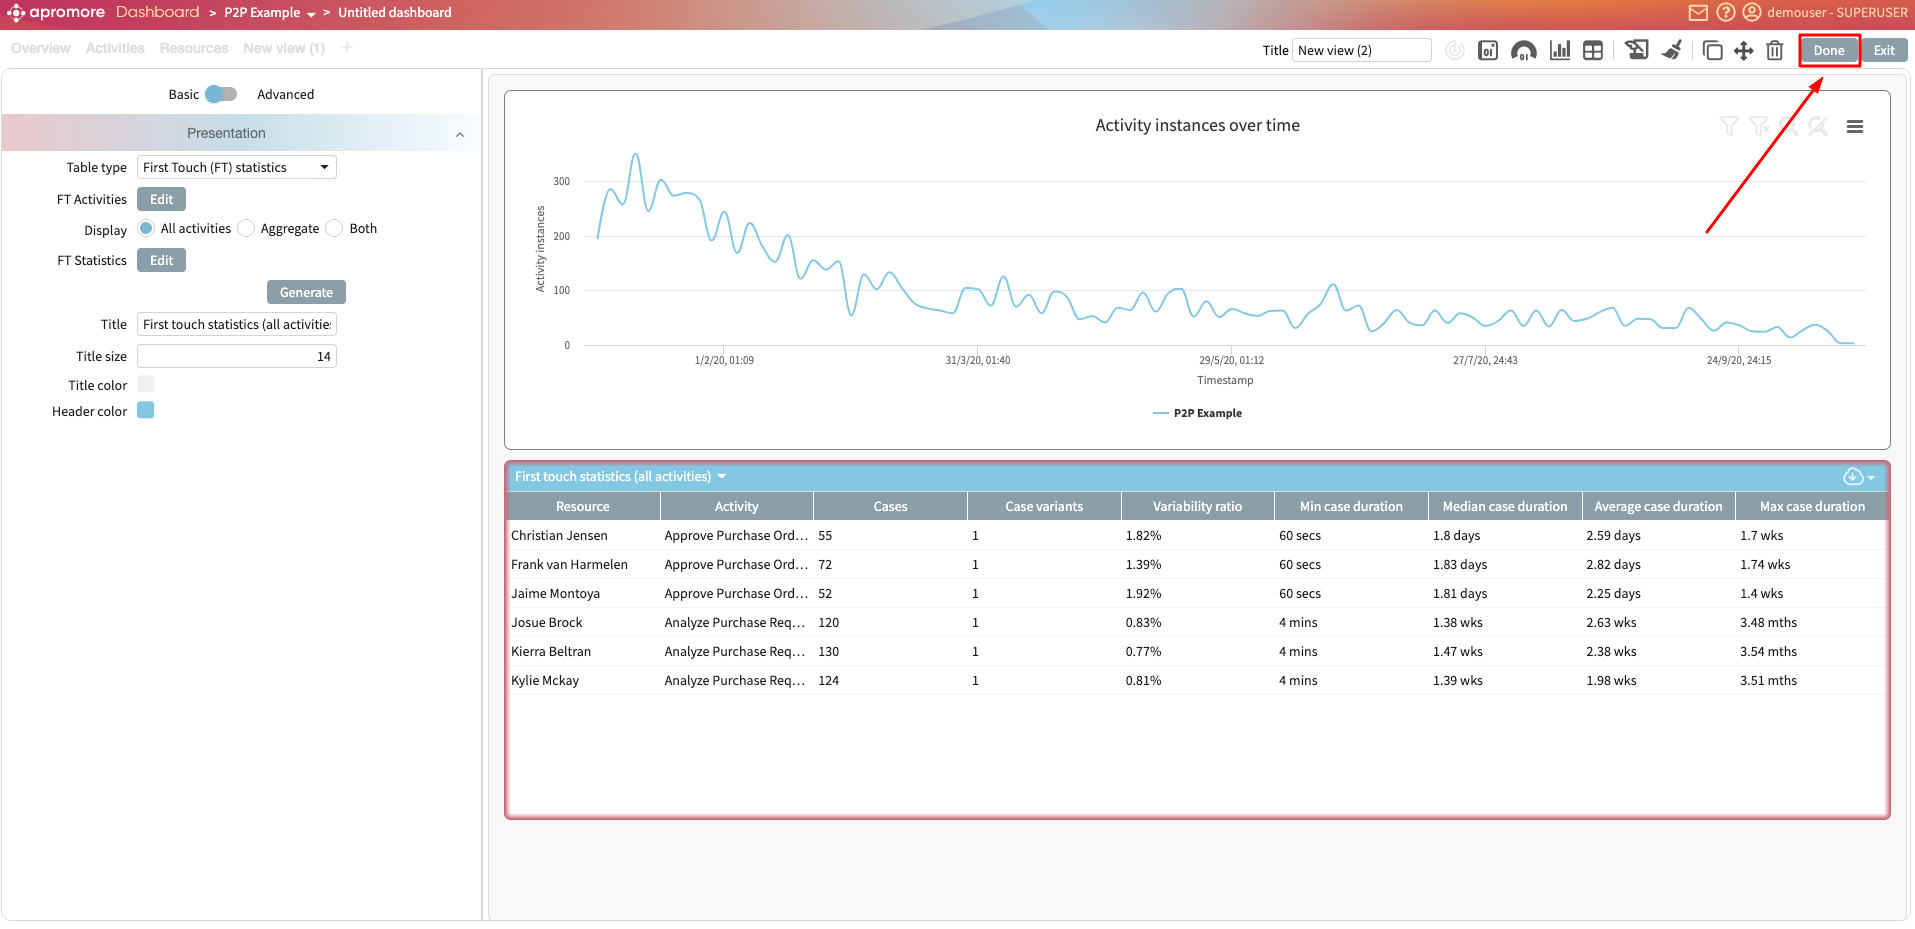 .
.
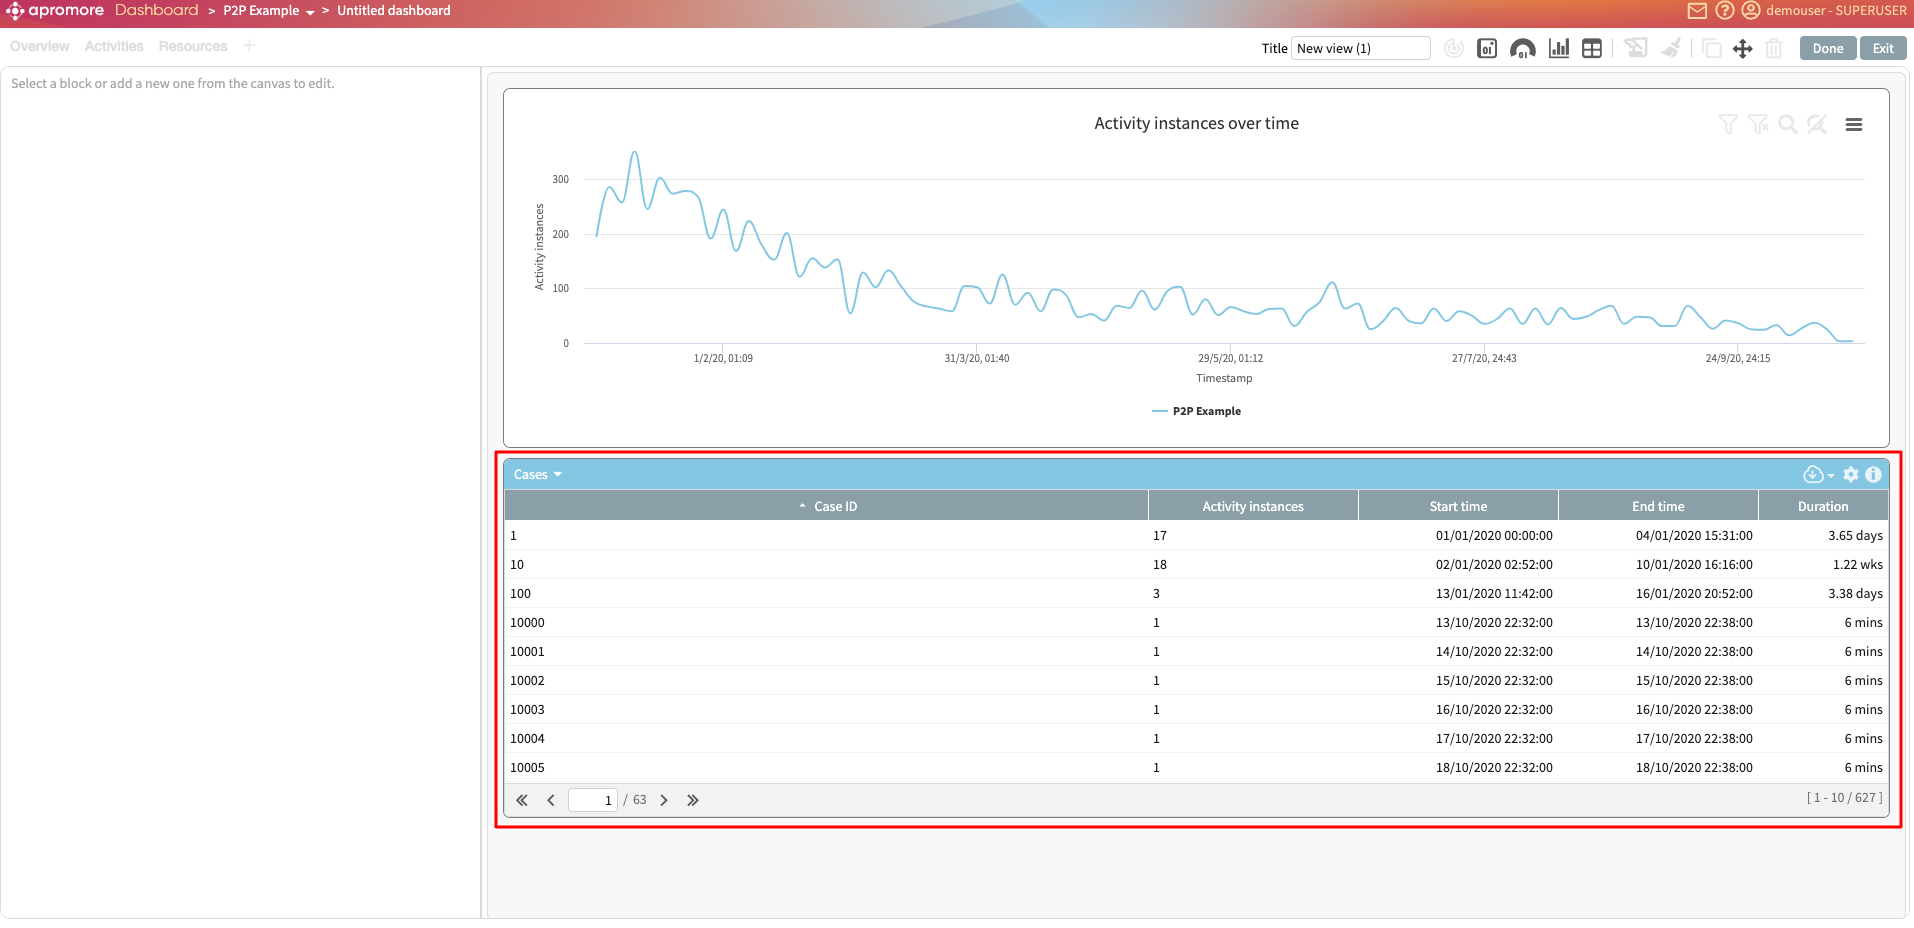
The table is added to the view and can be configured.

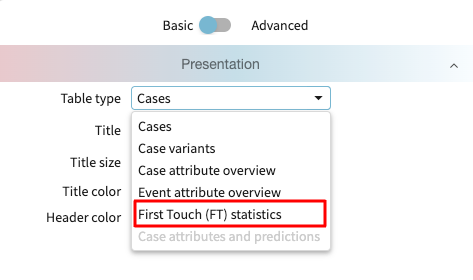
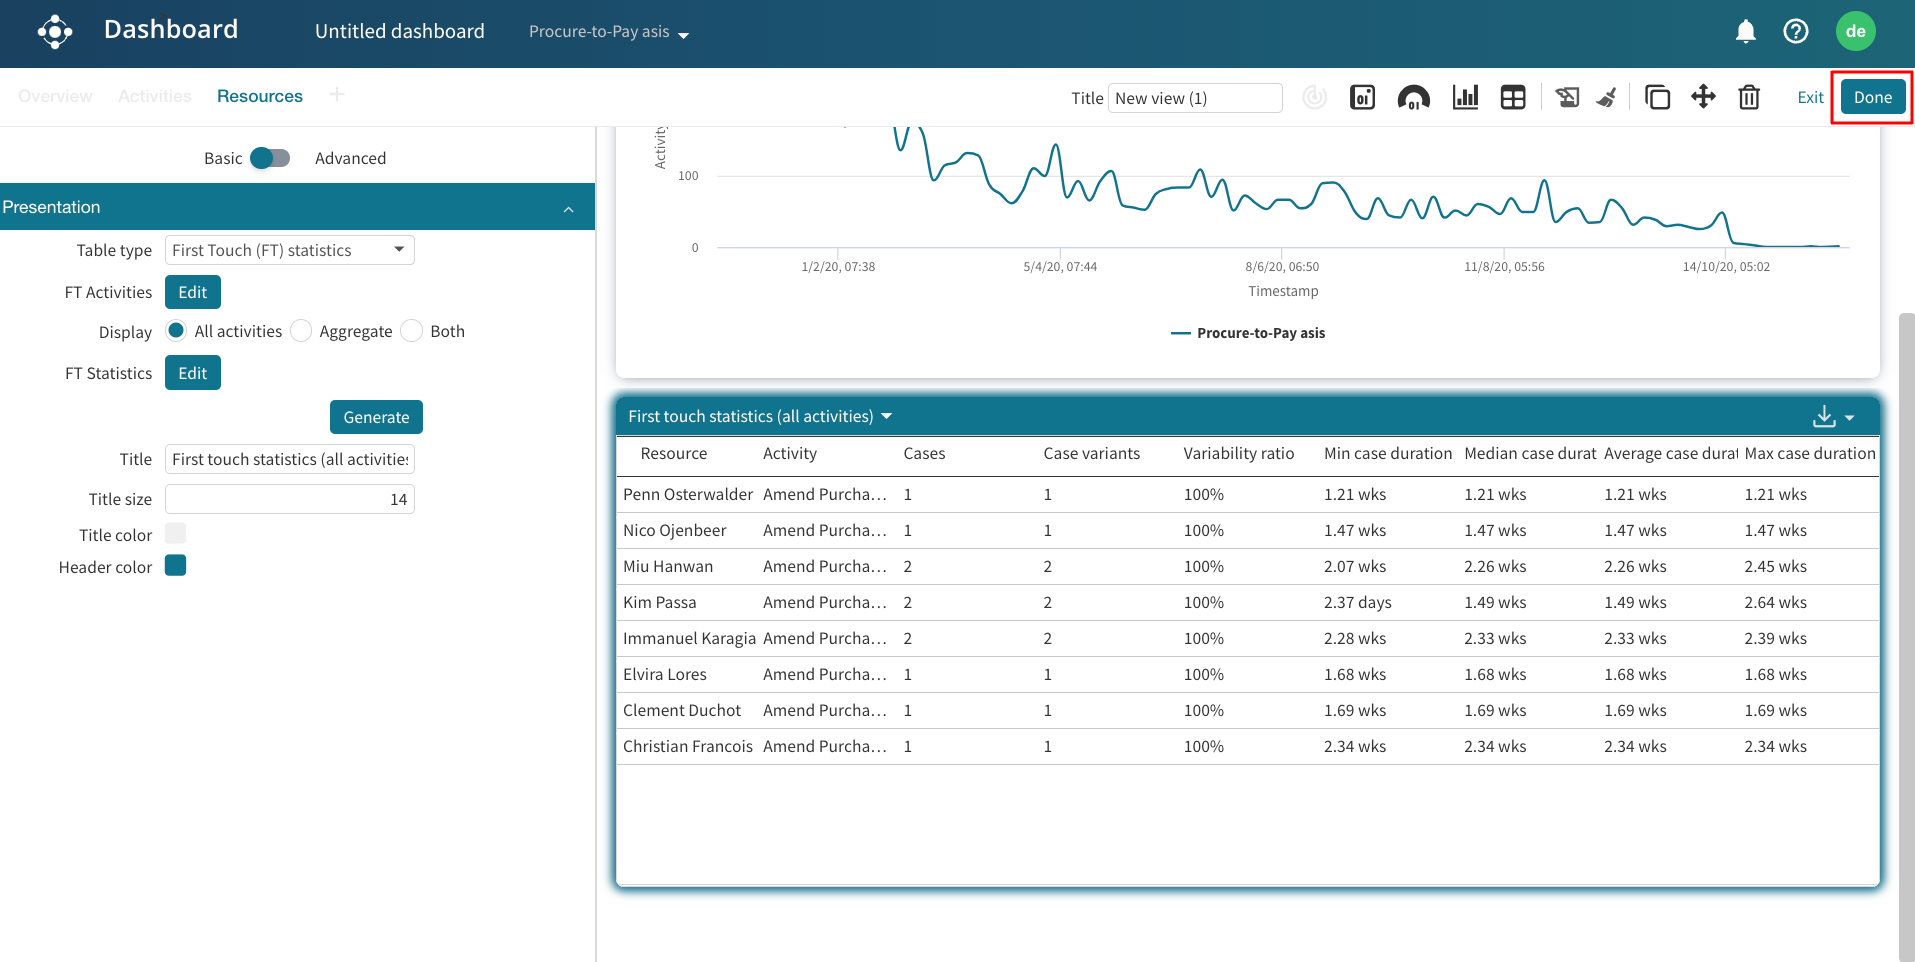
Click on the table to configure it. In the configuration panel that appears, we can change the table type. For instance, we can select First Touch (FT) statistics to create a first-touch metrics table.

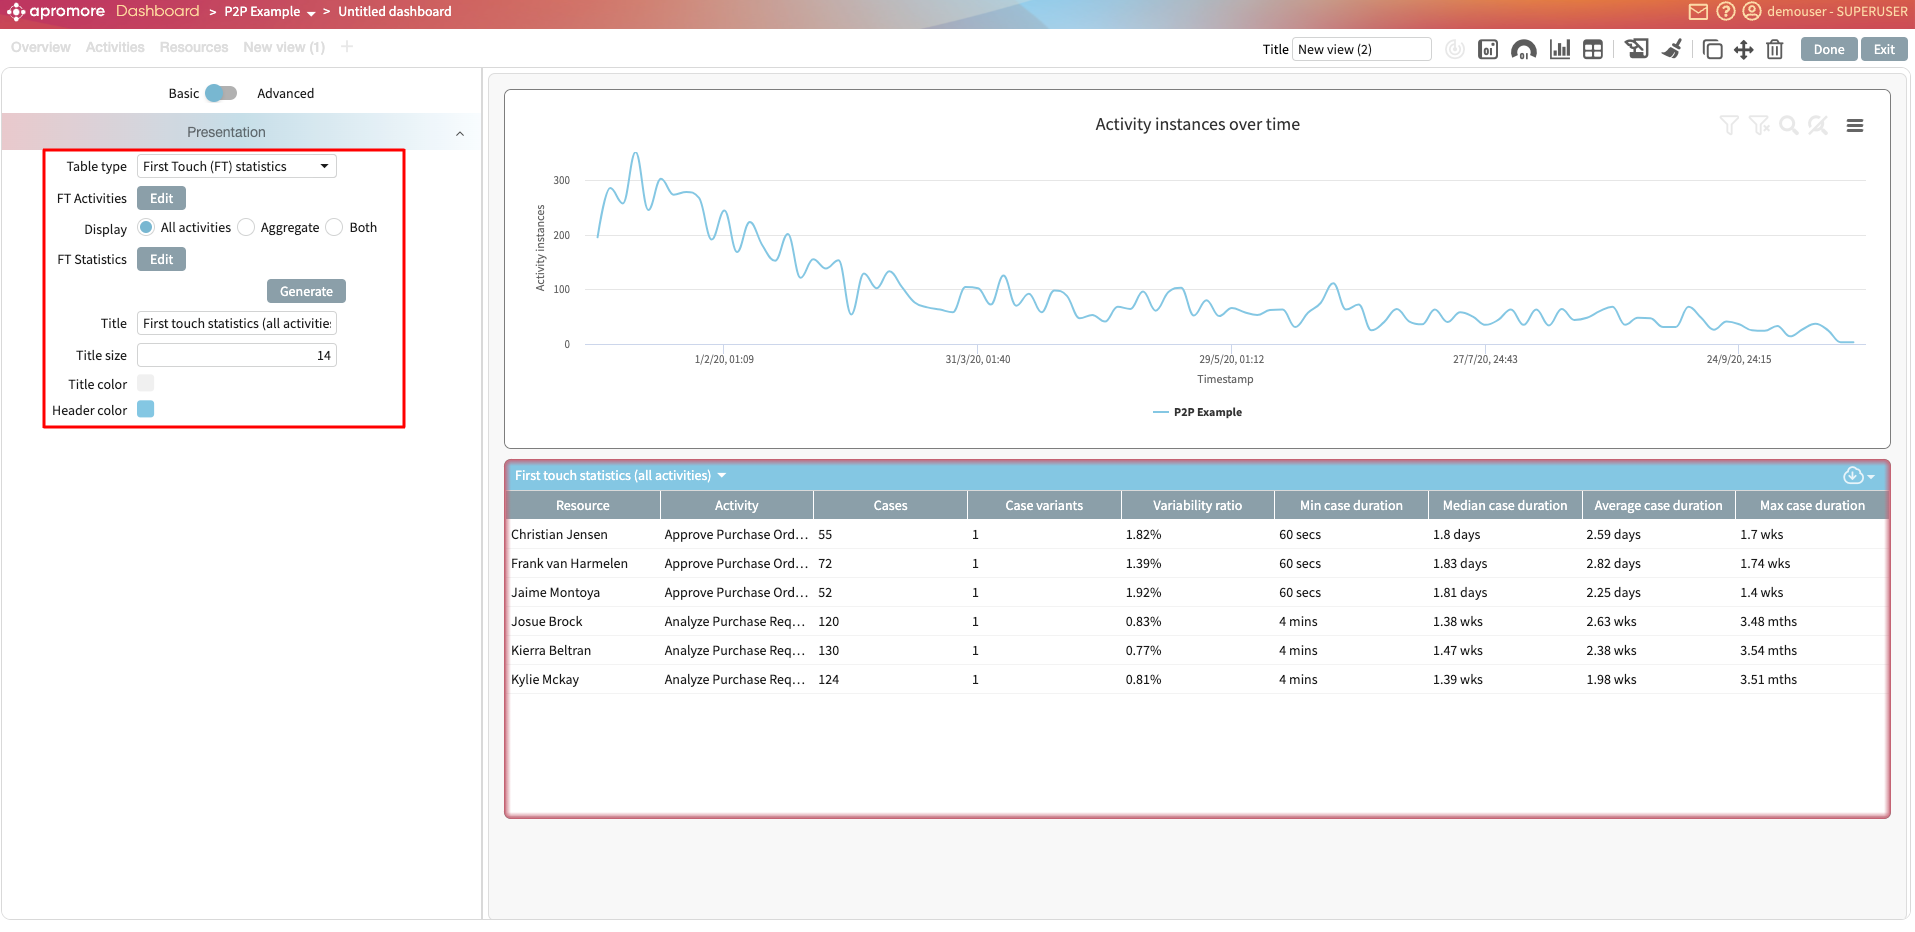
We can select the activities to be considered as first-touch activities. We can also specify the first-touch statistics to display. Click Generate.

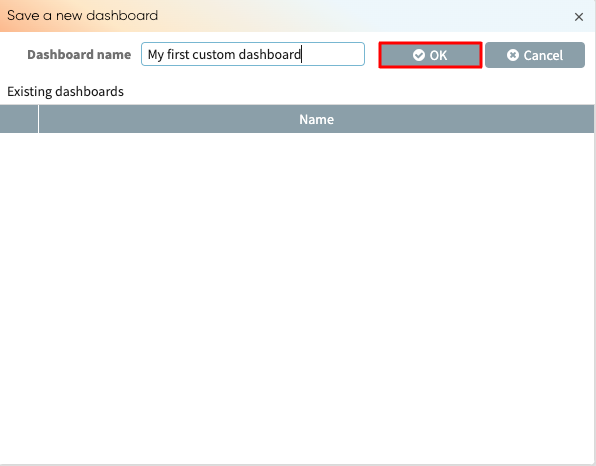
Click Done to save the dashboard.
We’d be prompted to name the dashboard. Click OK.