Drill-through from Process Discoverer to Dashboard
When we apply a filter in Process Discoverer, we can create a dashboard to visualize the performance statistics of the log with the applied filter. This is called a drill-through from Process Discoverer to Dashboard. When we drill-through from Process Discoverer, a dashboard is created displaying the filtered statistics in charts, gauges, tiles, or tables.
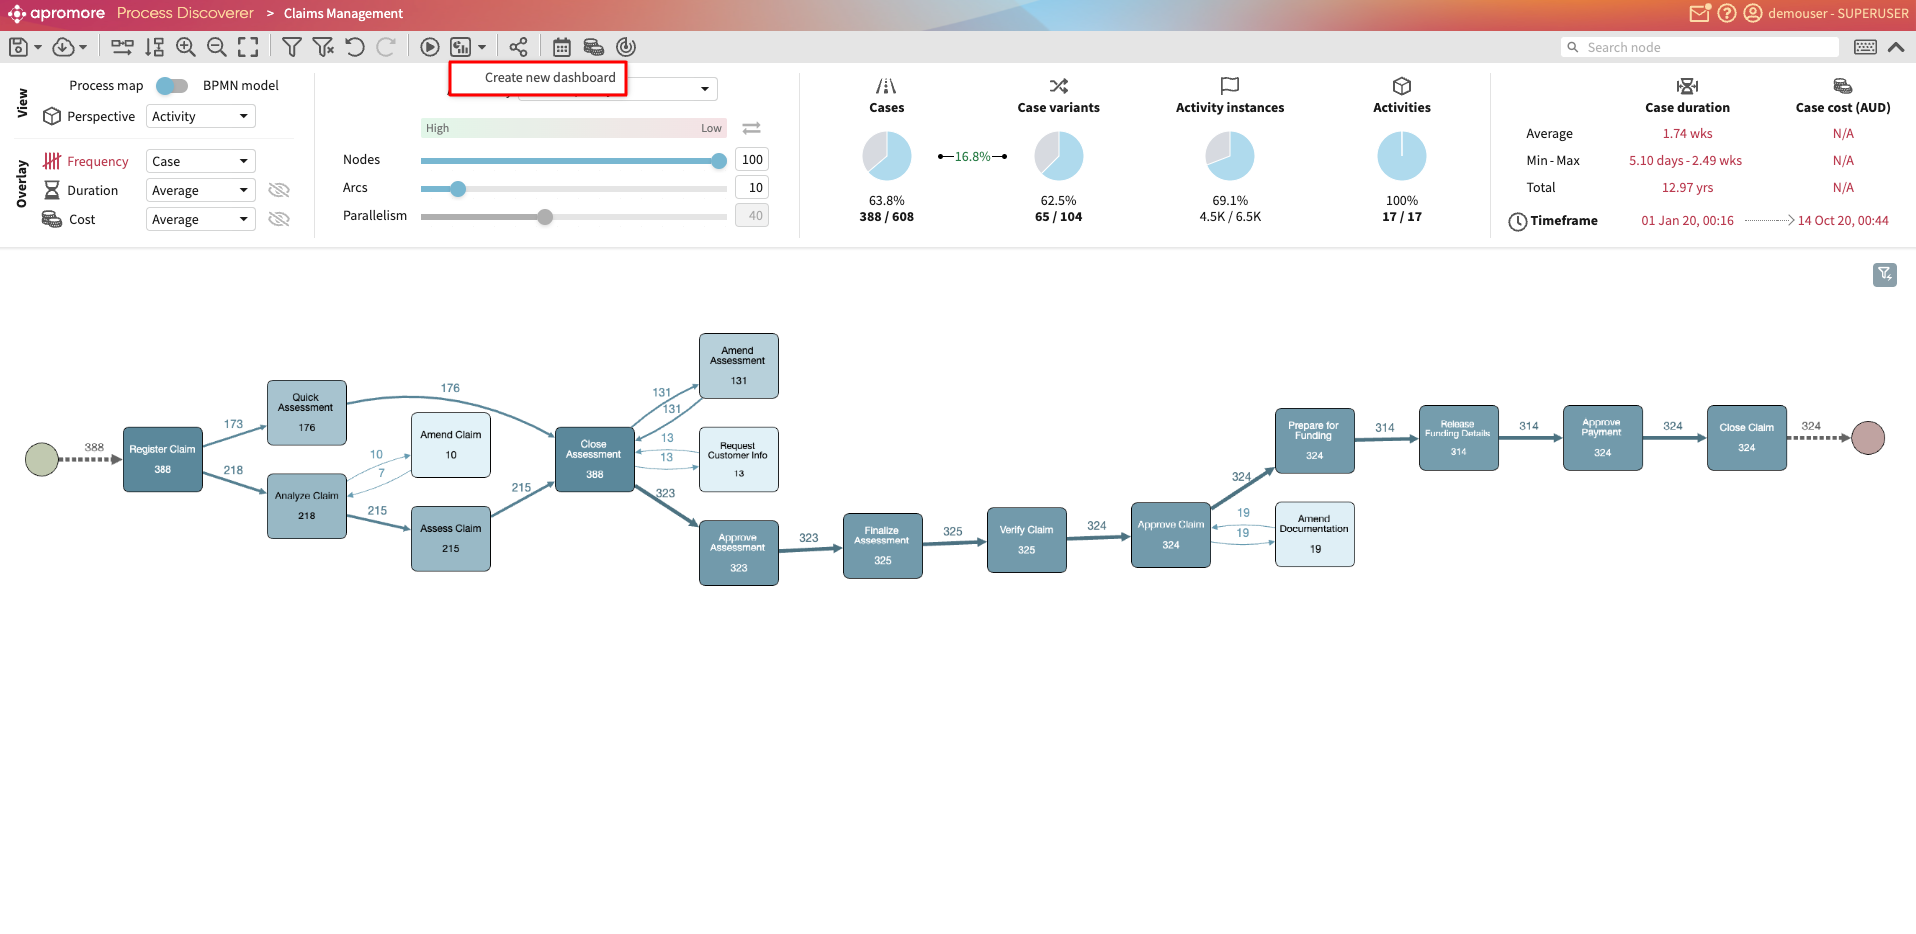
To drill through to the Dashboard, click the “Create new dashboard” button in Process Discoverer.
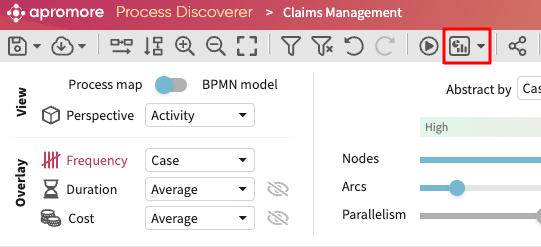
Click Create new dashboard.
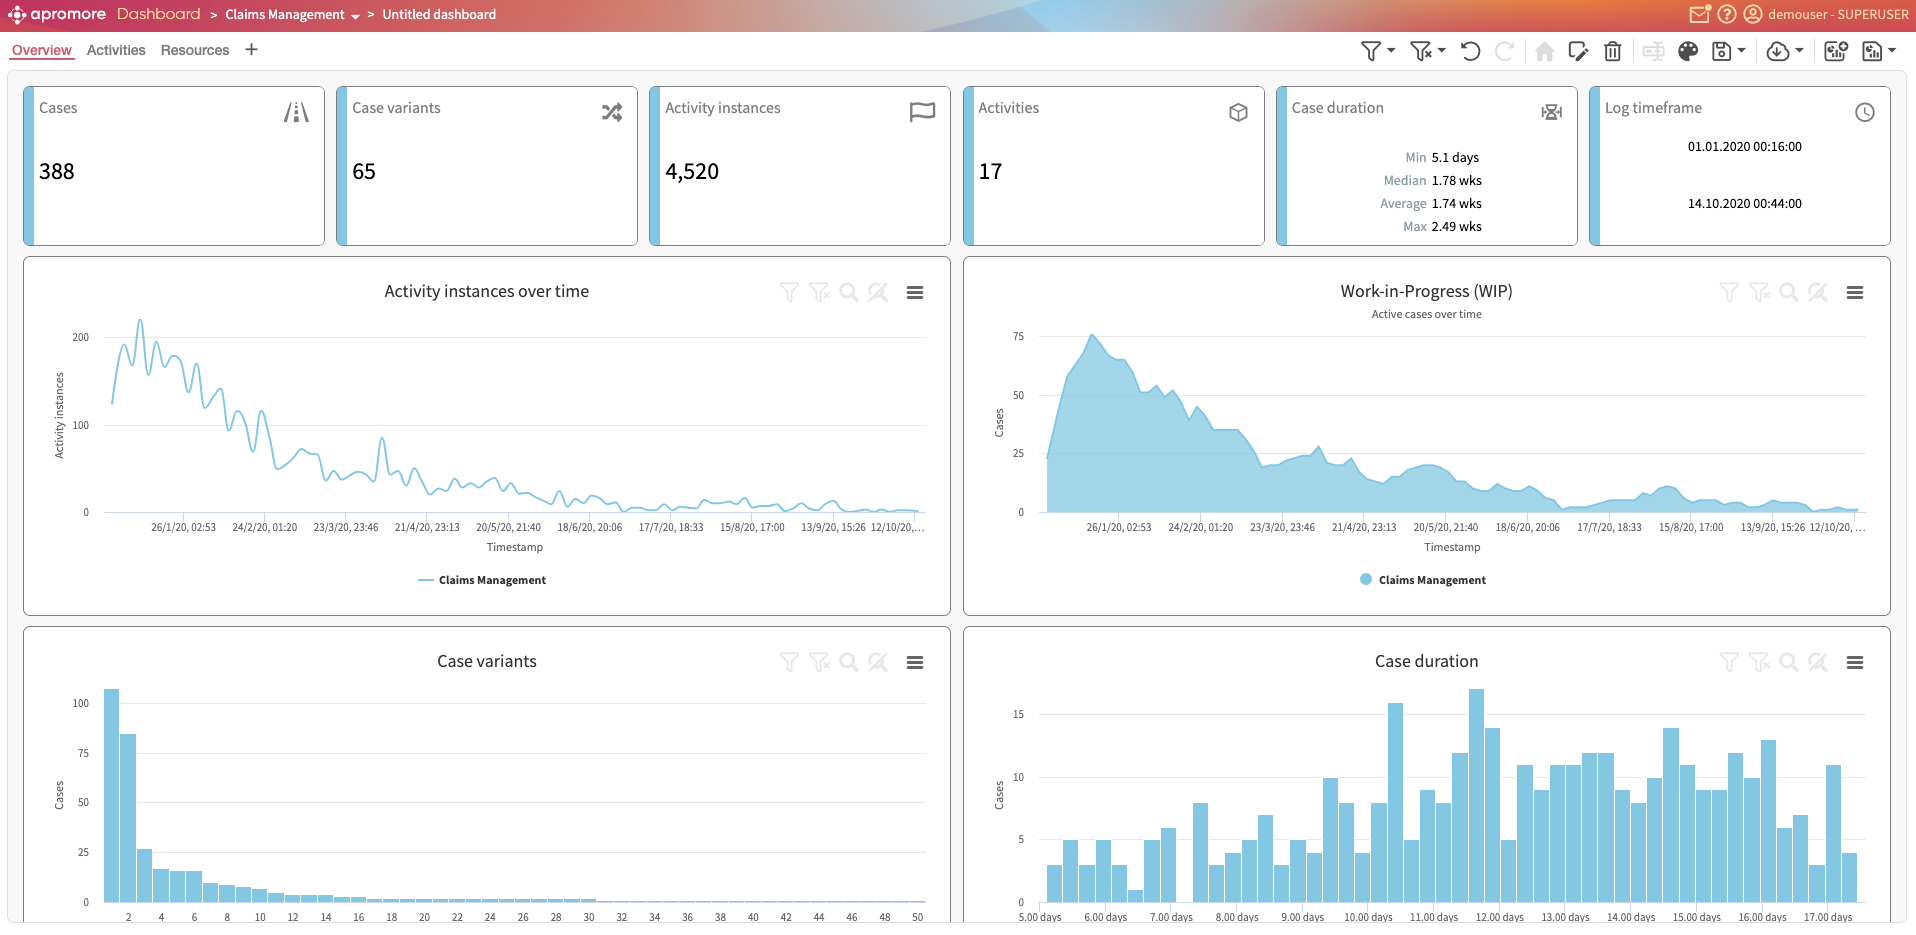
This opens the Dashboard with the applied filter.