Animate multiple logs
Apromore allows us to animate multiple logs to capture different variants of the same business process. For instance, one log may filter cases where the case duration is less than two weeks, while the other log filters cases where the case duration is greater than two weeks.
Note
To animate multiple logs, Apromore requires the corresponding BPMN model of the log. The BPMN model would represent a normative specification of how things are performed in the process. The animation is displayed on top of the BPMN model.
To animate multiple logs, select the BPMN model and the log files. Right-click and click Animate log.
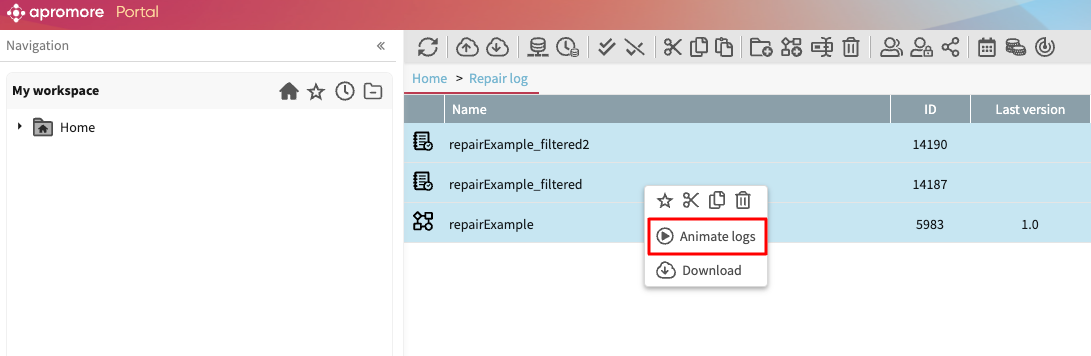
Alternatively, we can animate multiple logs by selecting the BPMN model and the log files and clicking the animate log icon in the menu bar.
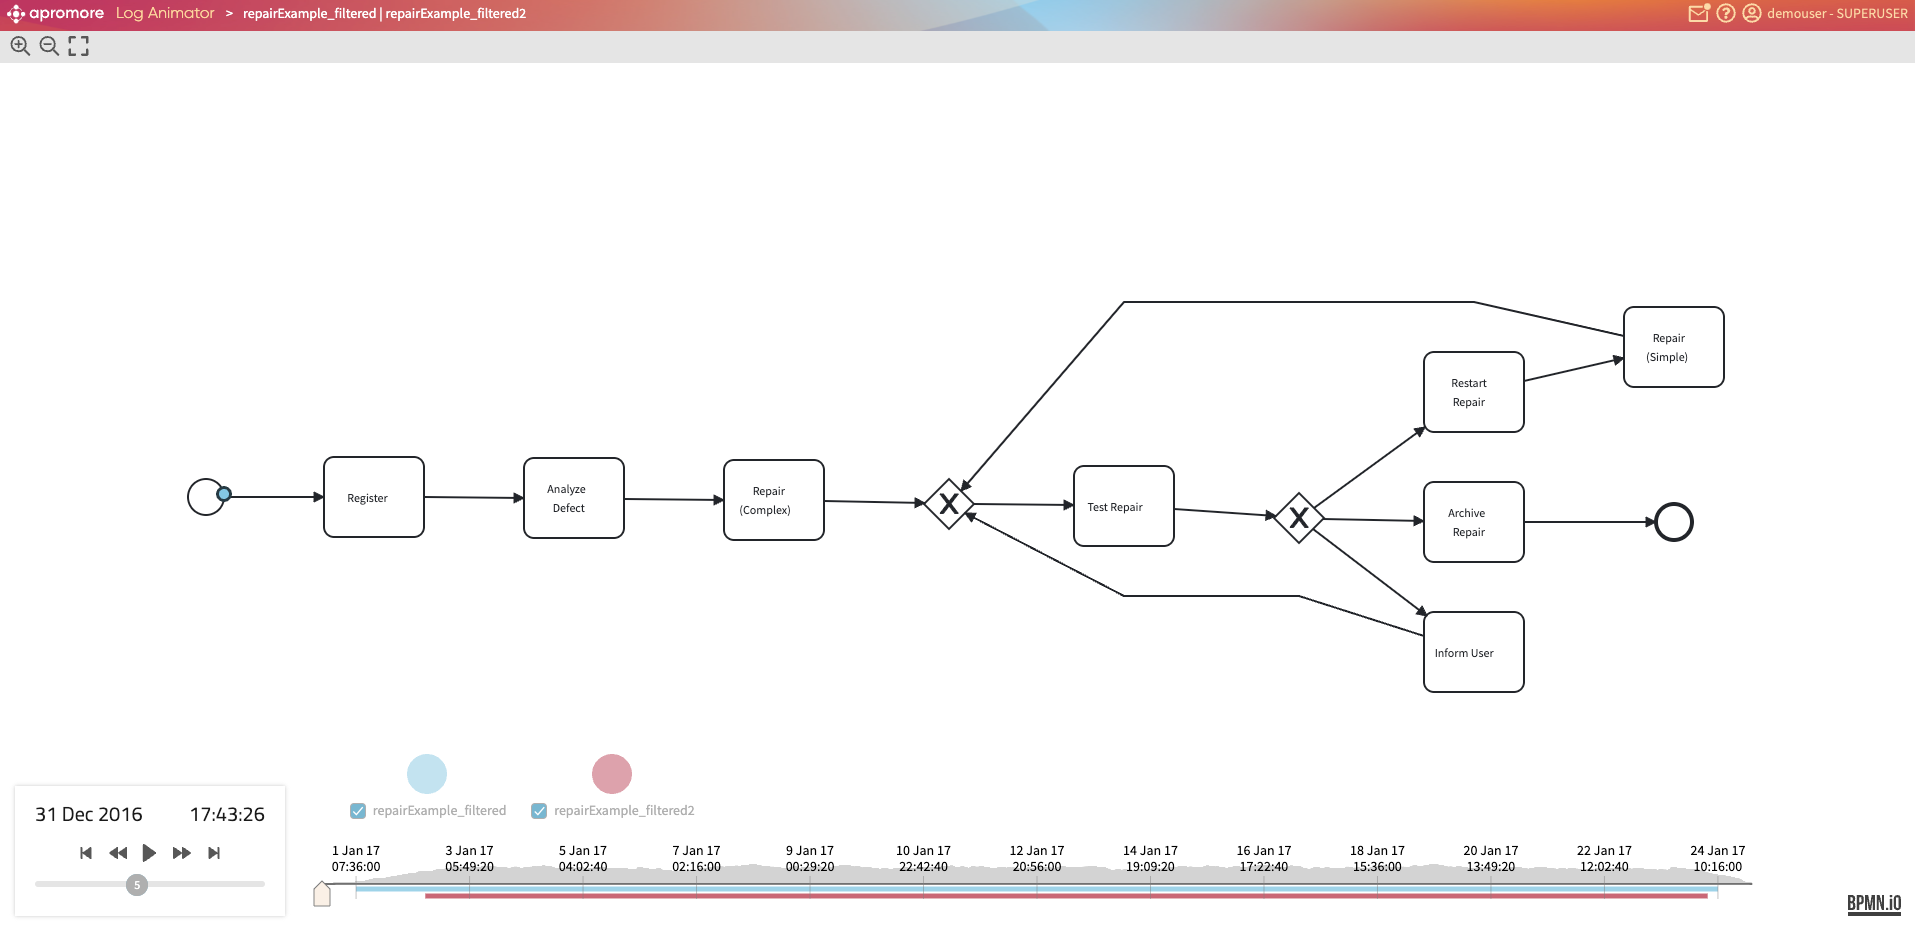
This opens Log Animator , which shows the BPMN model along with the timeline.
Note
The log animator in Apromore cannot handle process models where two tasks have the same label.
Note
We can also animate one log and a model using Log animator. Select the log and the corresponding model, right-click and click Animate log. When animating one log however, it may be convenient to animate the log using Process Discoverer. To learn more about animating a log in Process Discoverer, see Animate a log.
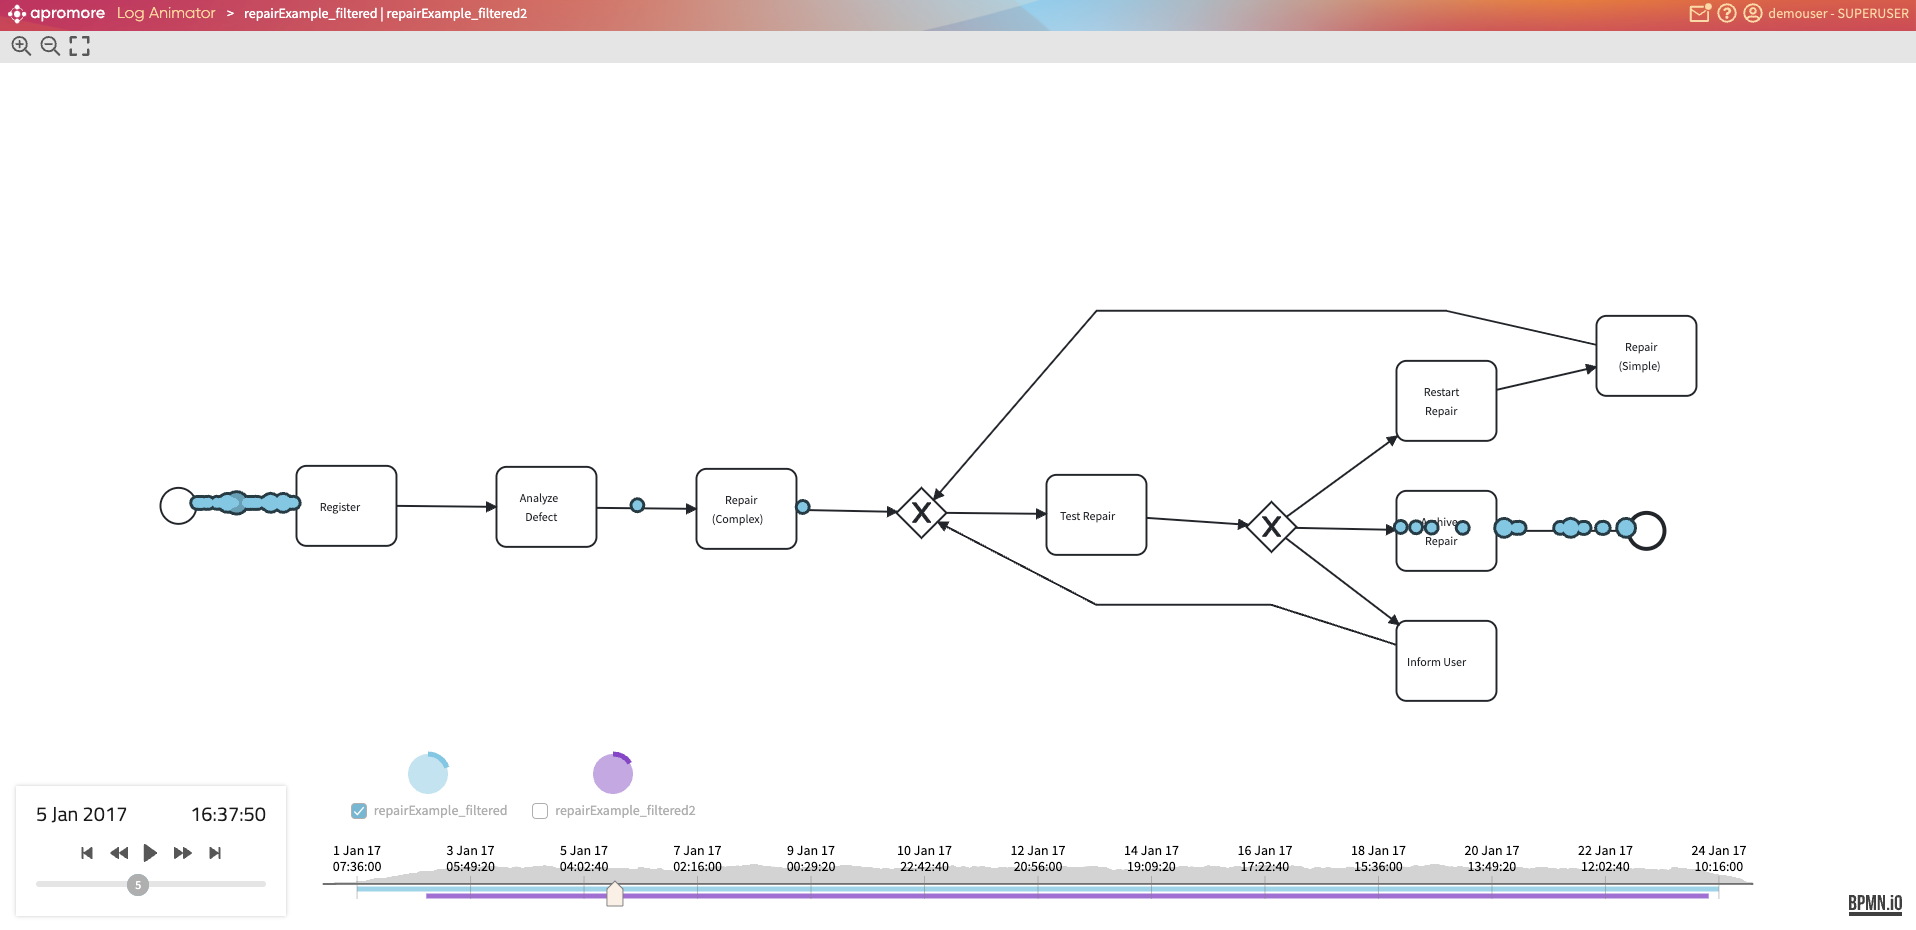
Standard controls
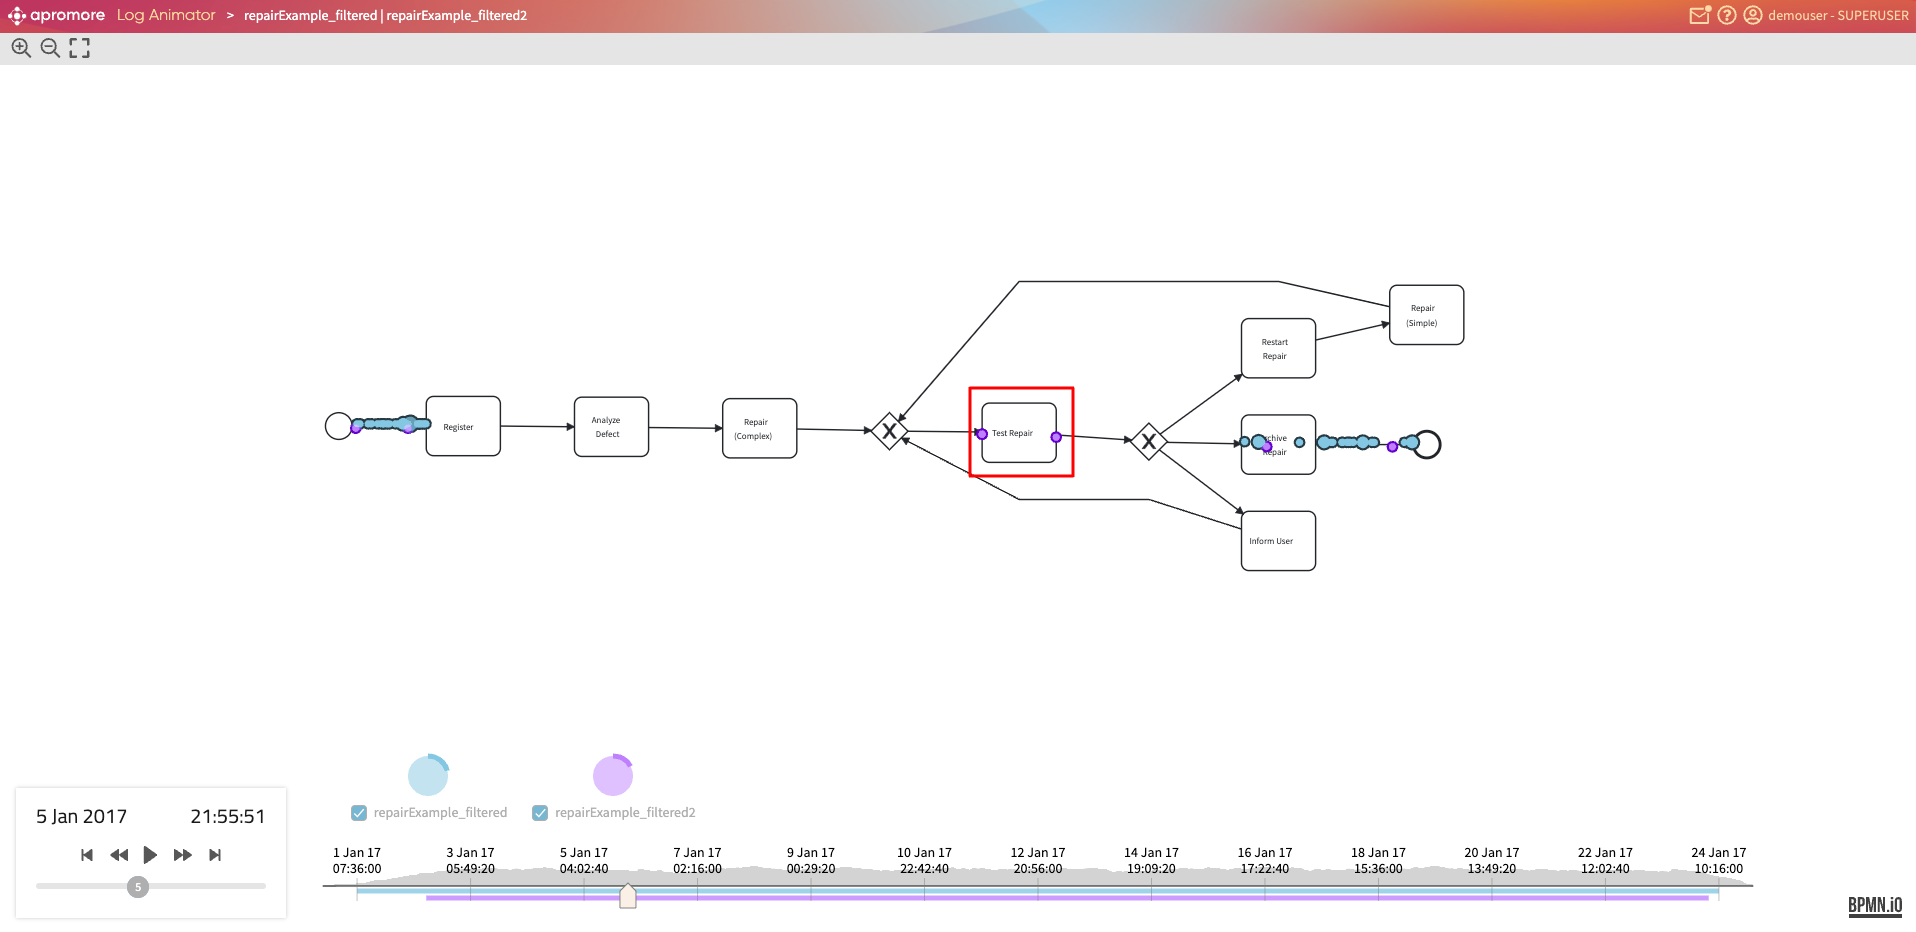
The animation starts by clicking on the Play button. Each token represents the progress of a particular process instance (a case), with the token’s color encoding the log from which the case comes.
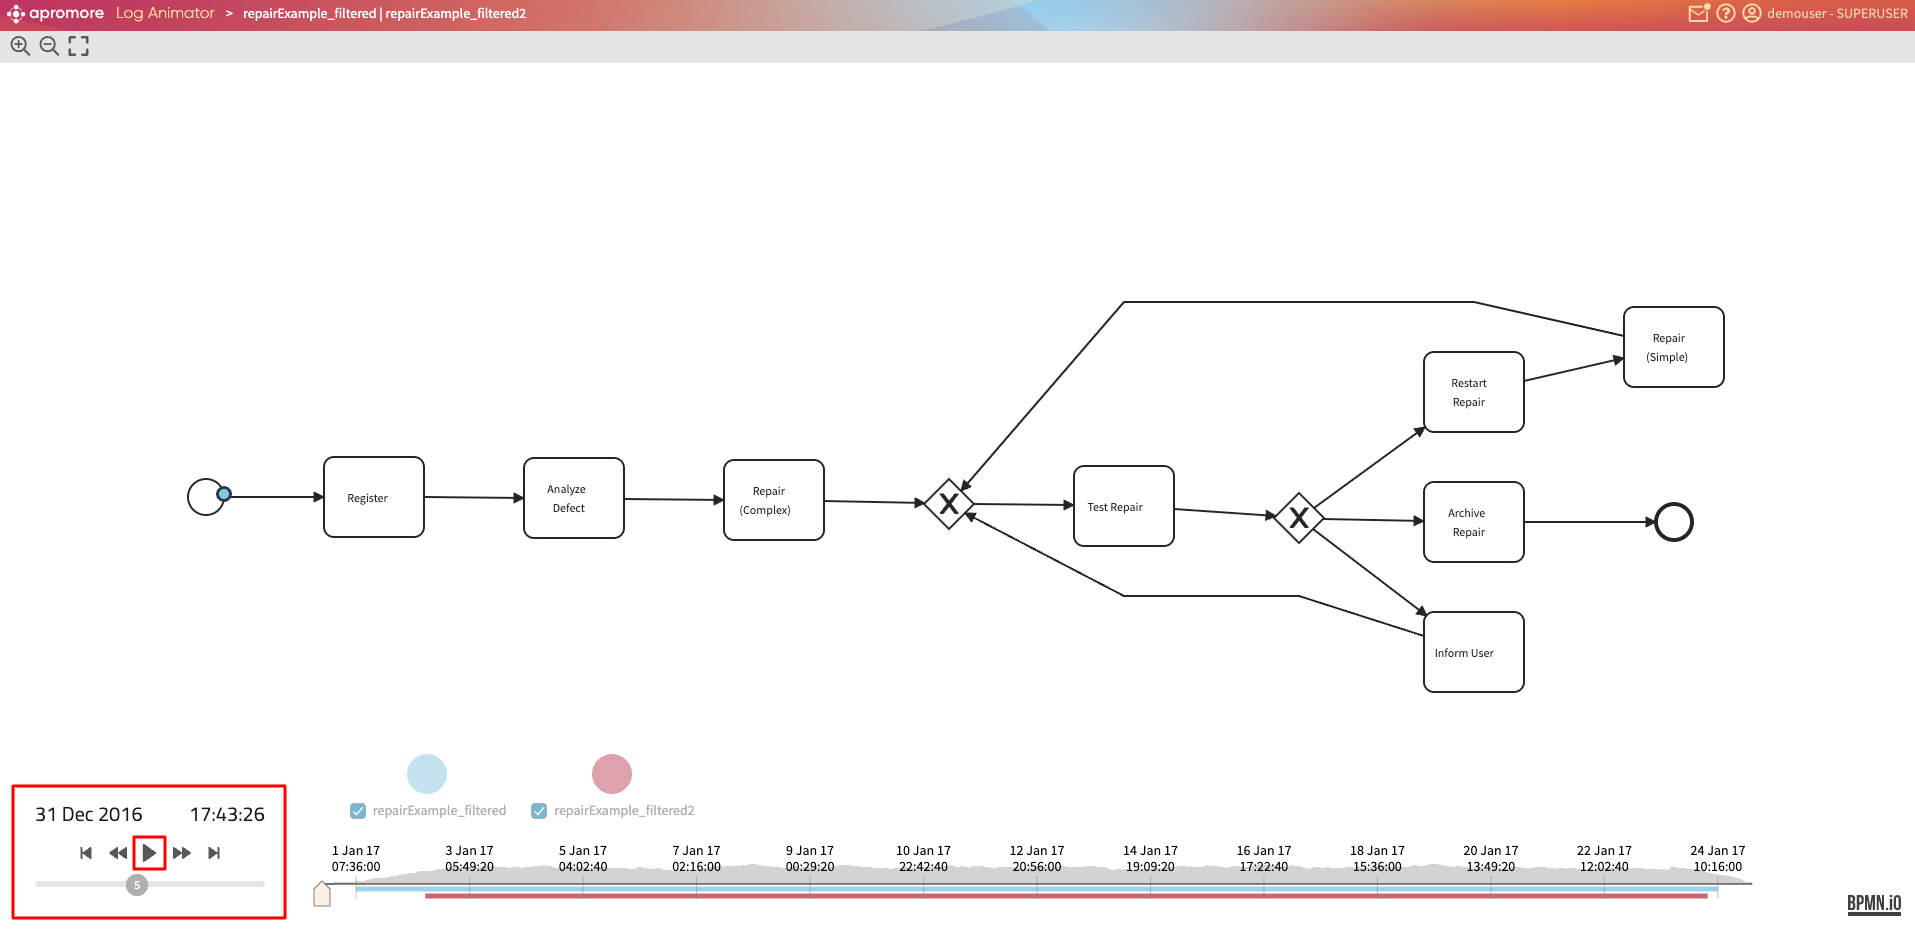
Standard controls are available to play, pause, fast or slow forward/rewind the animation and to skip through the end/beginning. The replay speed can be changed with the vertical bar. These actions are also available during the animation. If the view on the model is zoomed in/out or the model layout is changed, the tool will try to adapt the animation to the new position of the elements on the canvas.
Tip: To zoom in/zoom-out, press Ctrl and use the mouse scroll wheel.
We can change the color of tokens of a specific log by clicking on the pie chart next to the needed log name.
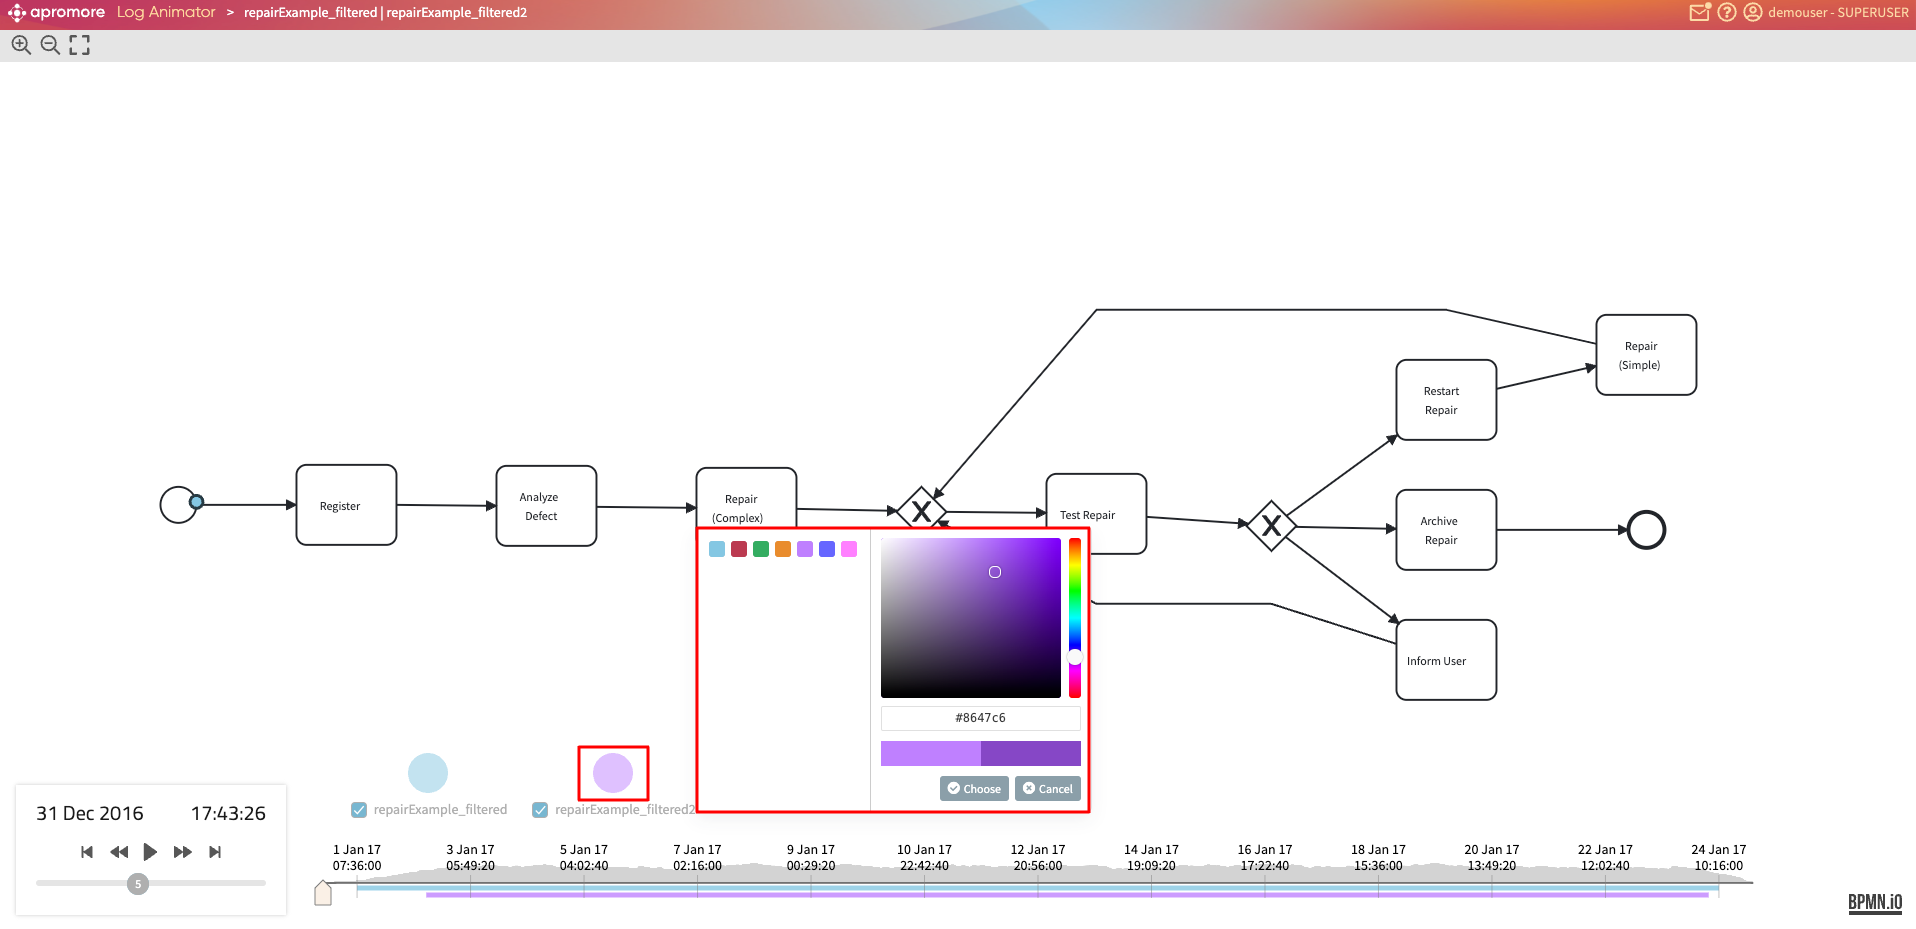
Note: We can either choose from the default colors or add customized ones. To add a customized color - enter a color code or drag the mouse over the palette.
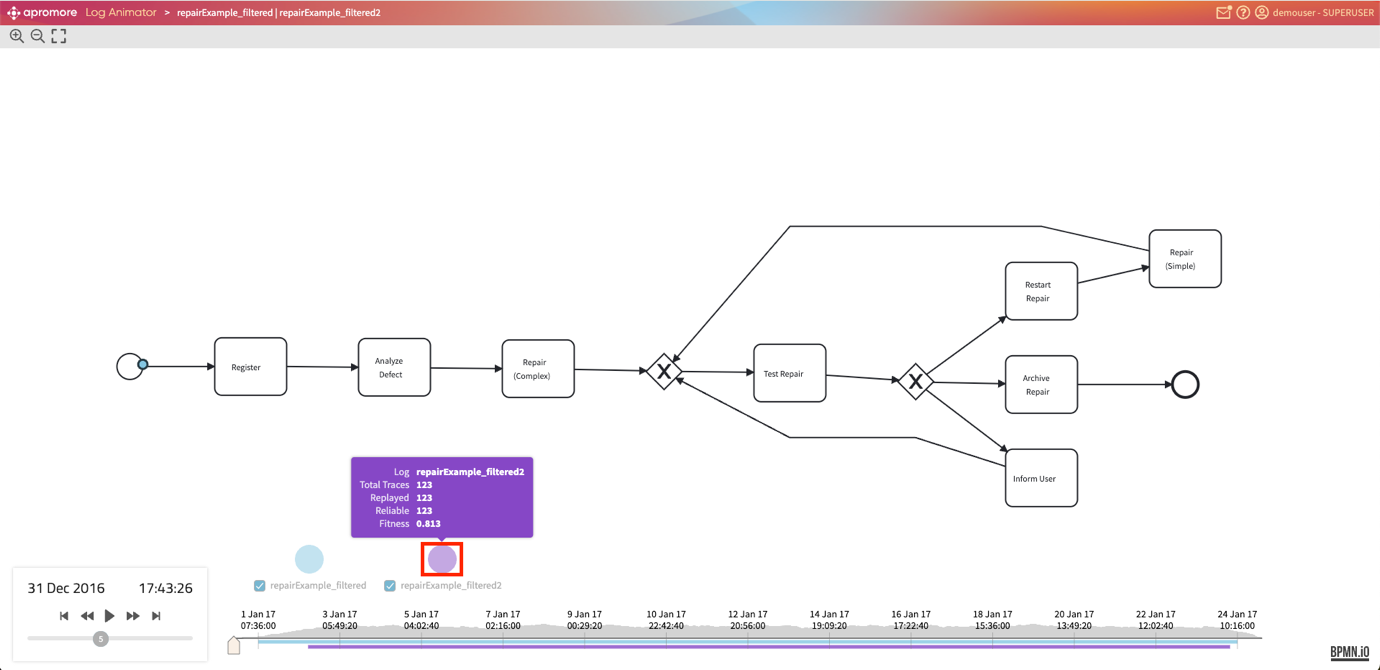
To check log-related statistics, hover over the pie chart next to the needed log name.
Token traversal
A token traversing an activity indicates that the case captured by that token is performing that activity. However, if the token goes around an activity’s border, this indicates that the particular activity is skipped in that process case.
A large number of tokens slowly traversing a given path may indicate a performance bottleneck, e.g. cases pile up at a particular point of the process due to resource unavailability.
For visualization purposes, we can hide and show individual/multiple log tokens by unchecking/checking the checkbox below the pie chart.