Investigate violating cases
After defining and operationalizing controls in the Compliance Center, we often need to identify and review the cases that violate these rules. To facilitate this inspection, we can quickly view, filter, and investigate cases that have failed compliance checks. This is done in the Violations page.
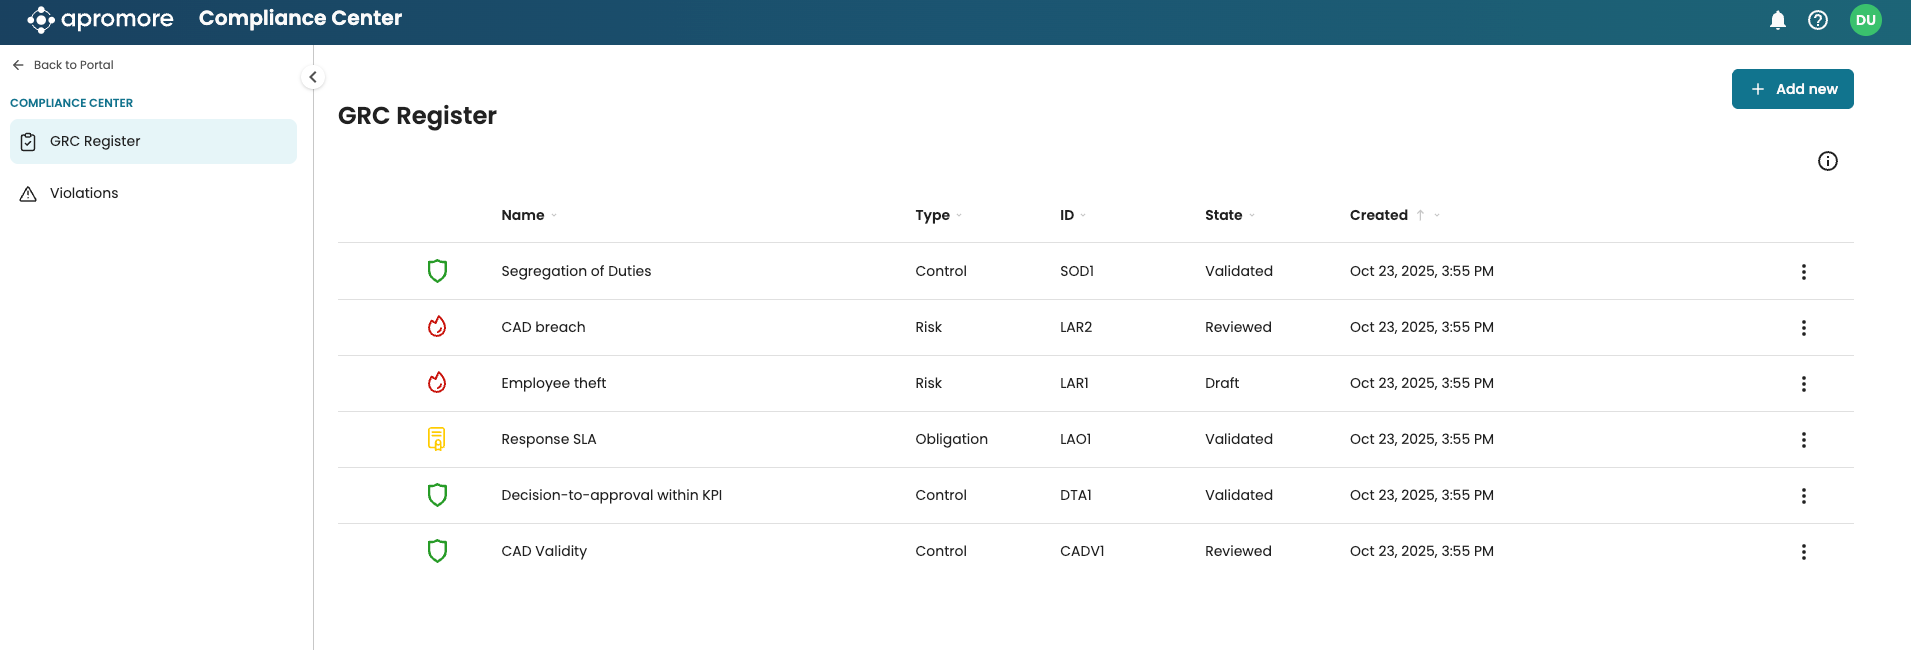
To access the Violations page, open the Compliance Center from the Portal. From the GRC Register, we can see the defined controls such as “Segregation of Duties”, “Decision-to-approval within KPI”, and “CAD Validity”.
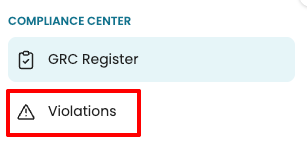
After these controls are created and operationalized, Apromore automatically runs compliance checks on the associated logs. To view the cases that did not meet these compliance rules, open the Violations page.
Note
To access the Violations page, the “Manage violations” permission must be enabled.
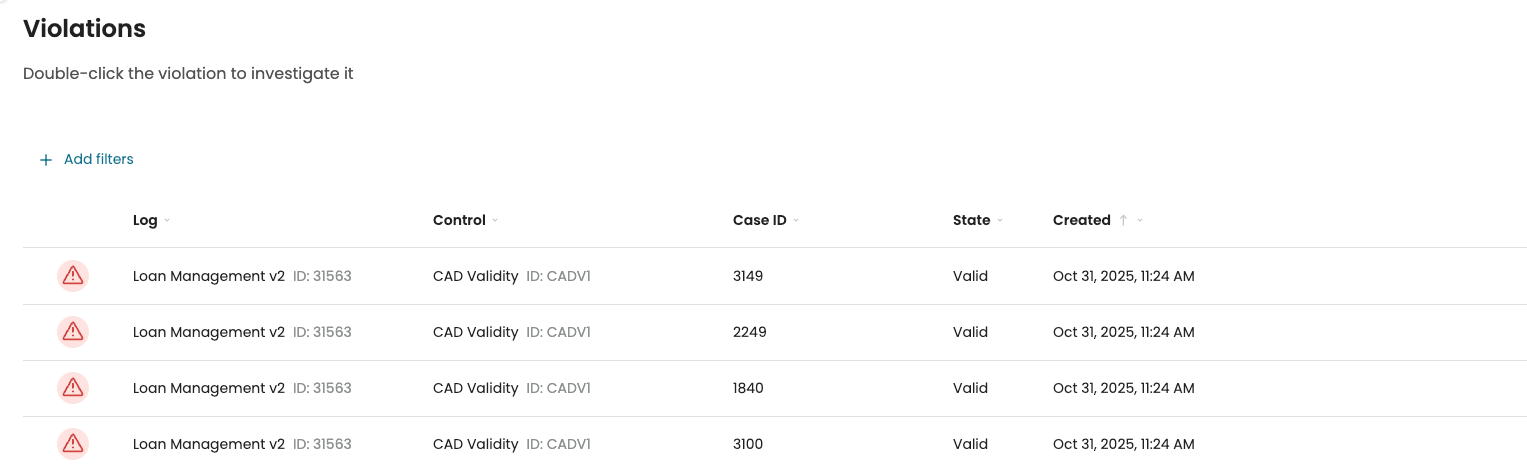
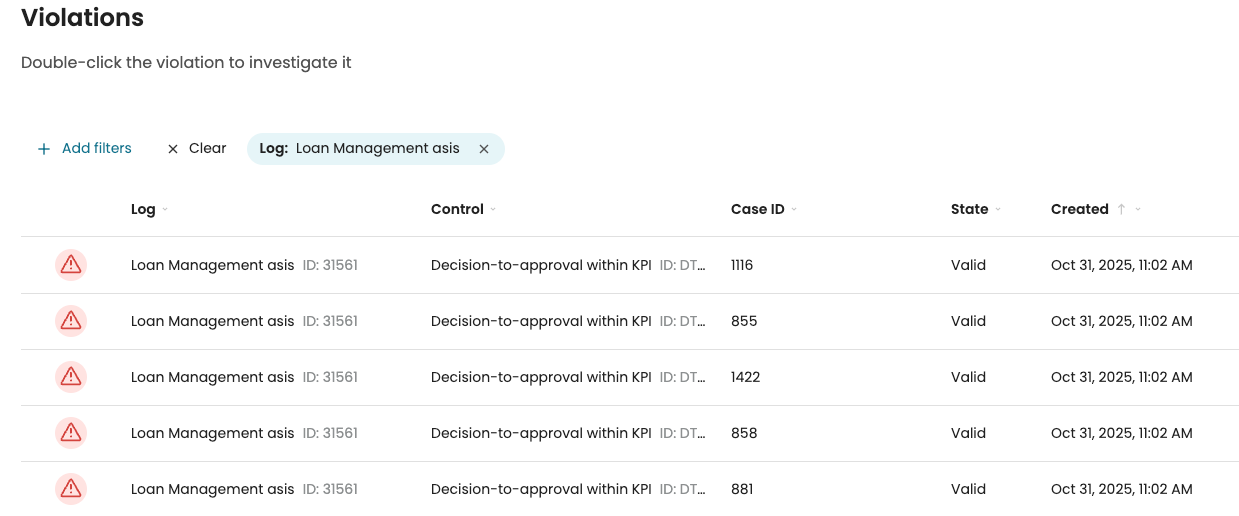
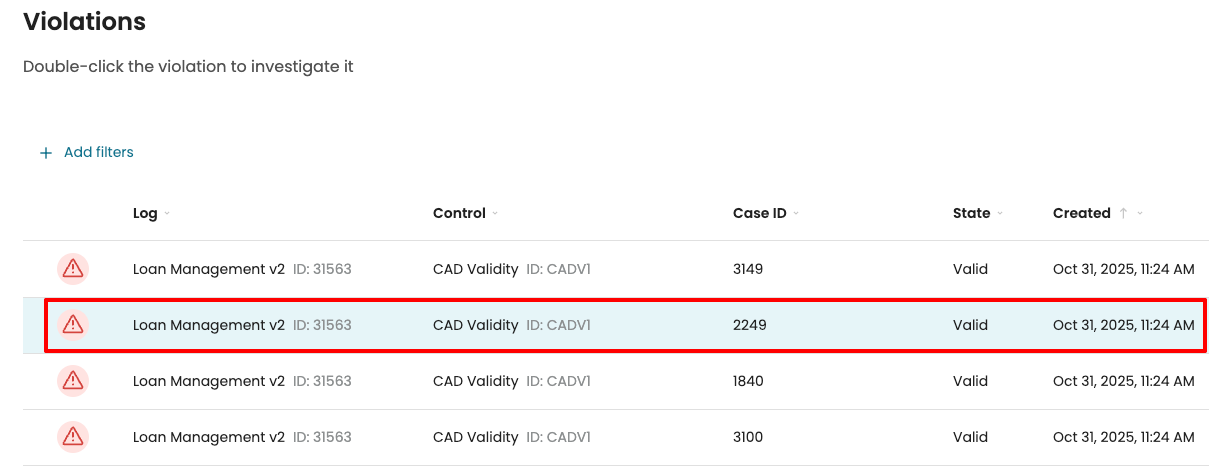
The Violations page displays all recorded violations from recent compliance checks. Each row represents a specific Case that failed one or more Controls, along with key details such as:
Log name
Control name
Case ID
Date of violation.
Note
The violations page displays all violations across all controls recorded in the compliance center. This means we can see violations from checks performed by other users, even if we do not have direct access to the related controls or event logs.
To focus on specific violations, we can filter the list of displayed violations. Violations can be filtered by Log, Control, or a combination of both.
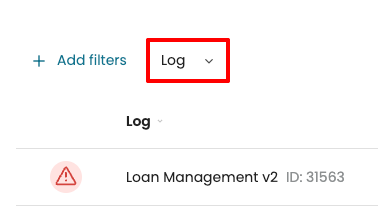
To filter by log, click Add filters > Log.
Click the Log dropdown.
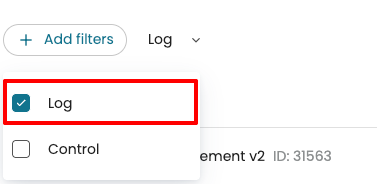
Select one or more logs to include and click Select.
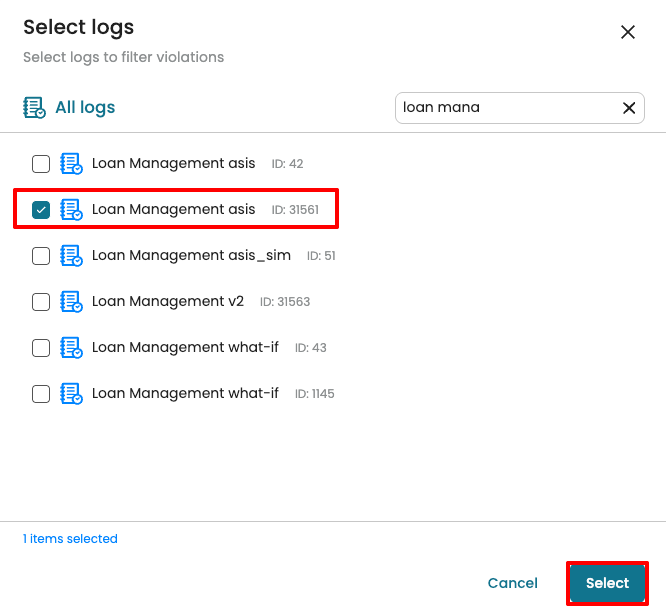
The list updates to show violations only from the selected log(s).
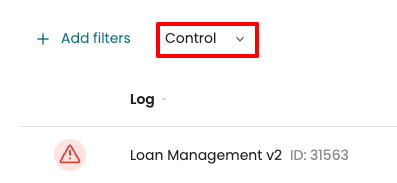
We may also wish to filter by controls. Click Add filters and select Control.
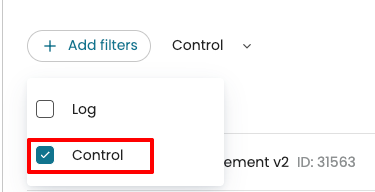
Click the Control dropdown.
Apromore displays all saved controls. Select one or more controls.
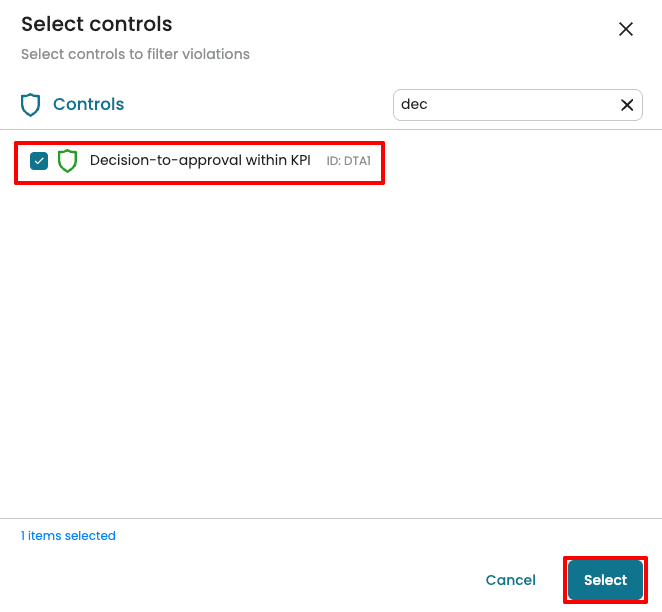
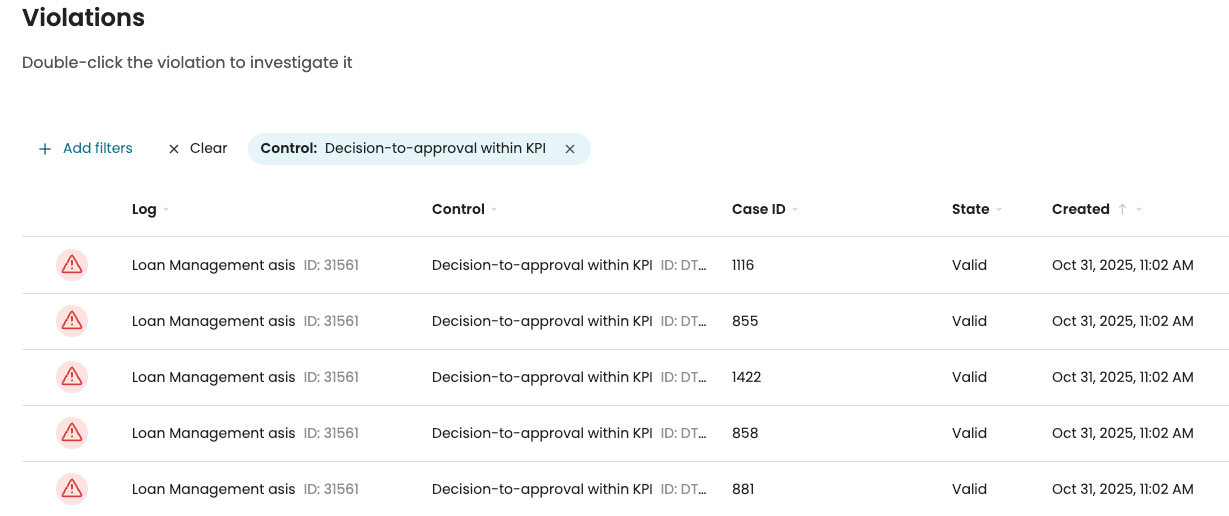
The list updates to show only violations related to the selected controls
We can also apply both Log and Control filters together to further refine the results.

Investigate a template-based control violation
We can investigate violations of template-based controls (controls based on templates) from the Violations page. For example, under the CAD Validity control, we may wish to review the events that occurred in Case 2249. Double-click the row to open the case.
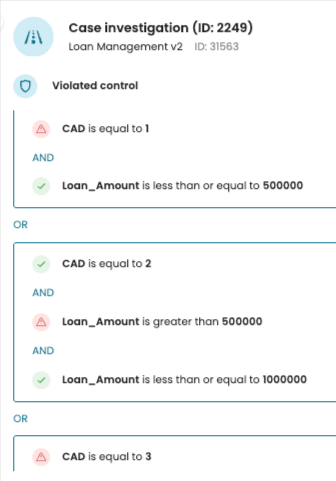
The Case Investigation page provides a summary of the compliance results for the selected case.
In this example, the control template contains three conditions, and none of the conditions were met. This means that the Loan Amount and CAD level values did not meet the defined criteria.
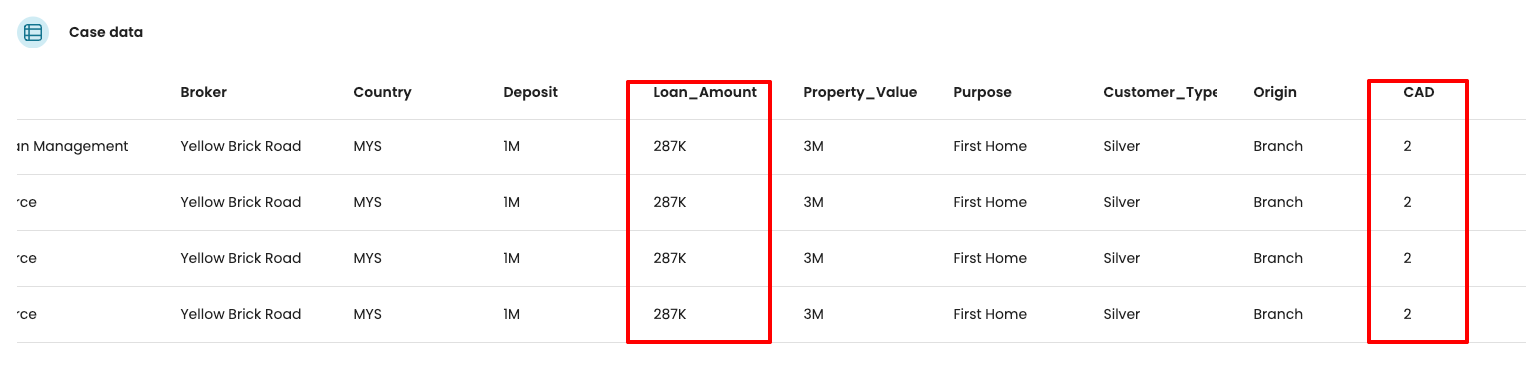
In the Case data section, we can see the specific values that led to the violation. Here, the loan amount for the case was 287K, while the CAD level was 2. However, according to the control definition, the CAD level should have been 1.
Each condition in the control template can be inspected in detail. To see the data that caused a specific condition to fail, click the corresponding condition. For instance, “CAD is equal to 1.”
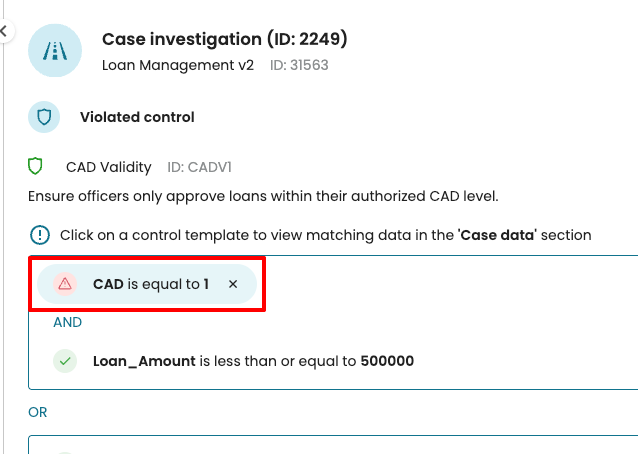
The Case Data view updates to show all activities where the CAD Level equals 2, highlighting the cause of the violation.
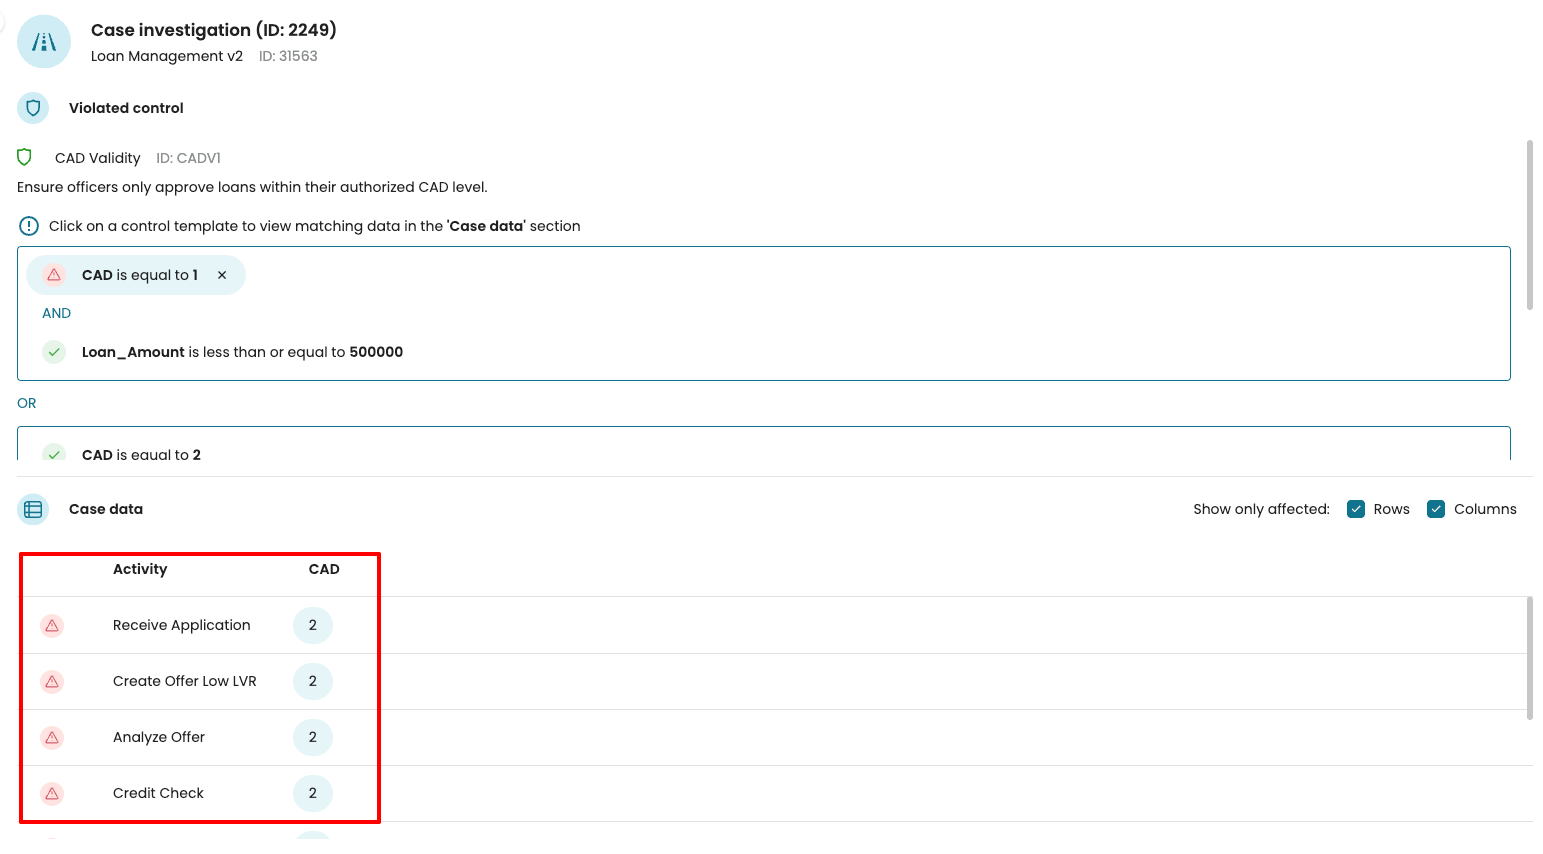
By default, the Case Data section displays both the affected rows and columns related to the violation.
We can customize this view as follows:
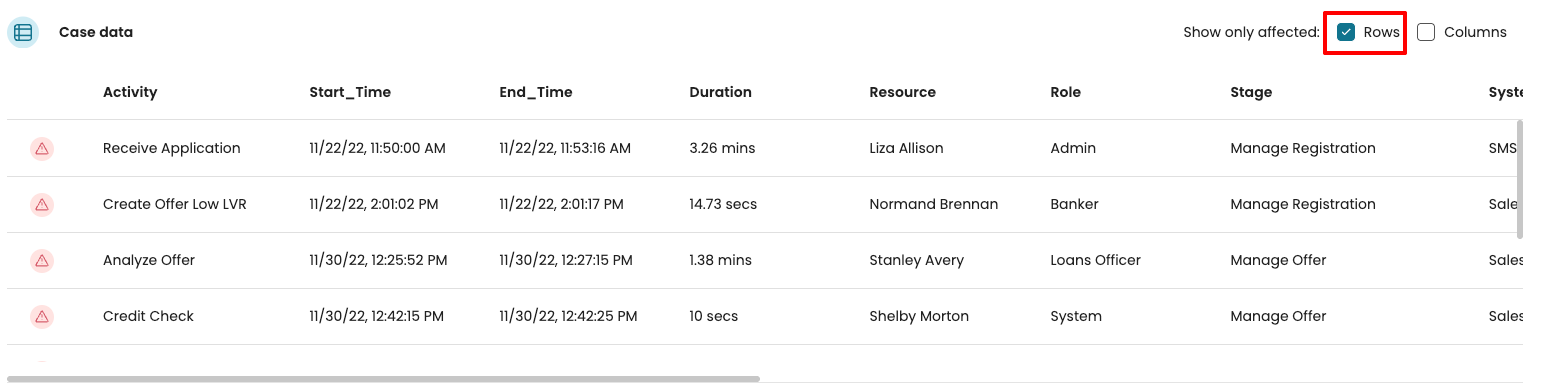
Show only affected rows: select Rows.
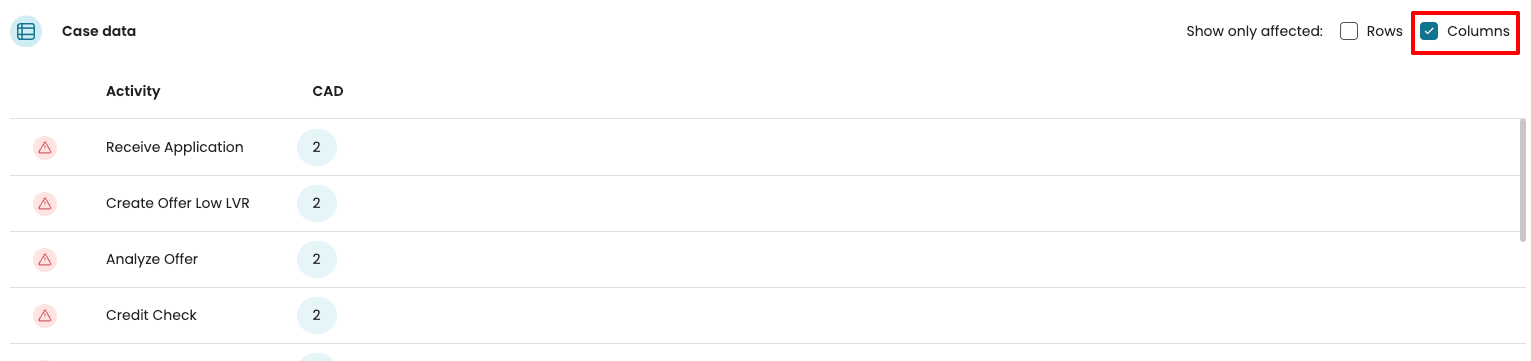
Show only affected columns: select Columns.
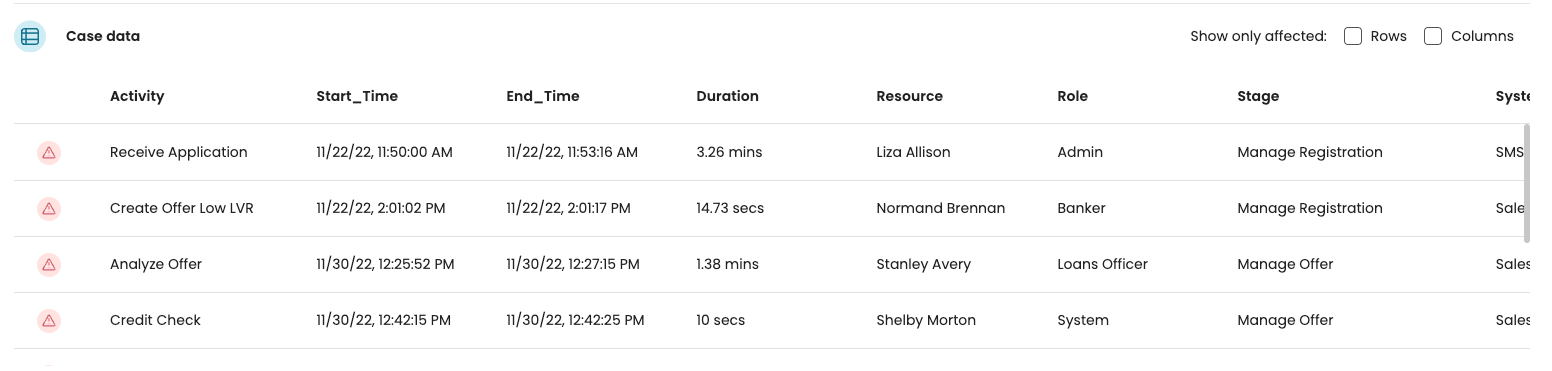
Show the full case: deselect both Rows and Columns.
For instance, if we wish to view only the affected rows, select Rows.
To display only the affected column, select Columns.
To display the entire case, deselect both Rows and Columns.
Investigate a filter-based control violation
We can also investigate violations of filter-based controls (controls based on filters) in the Violations page. To support the investigation, Apromore isolates the exact event or series of events that causes the violation.
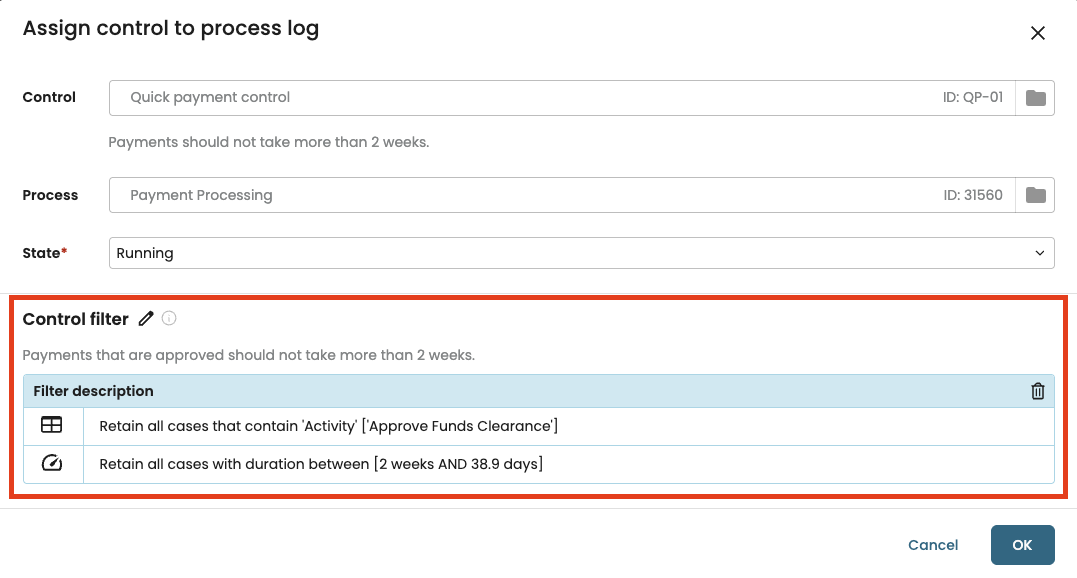
For example, in a payment processing process, let’s imagine we have created a “Quick payment” control that is based on a filter. The control checks that cases where “Approve Funds Clearance” occurred, must take at most two weeks, as shown below.
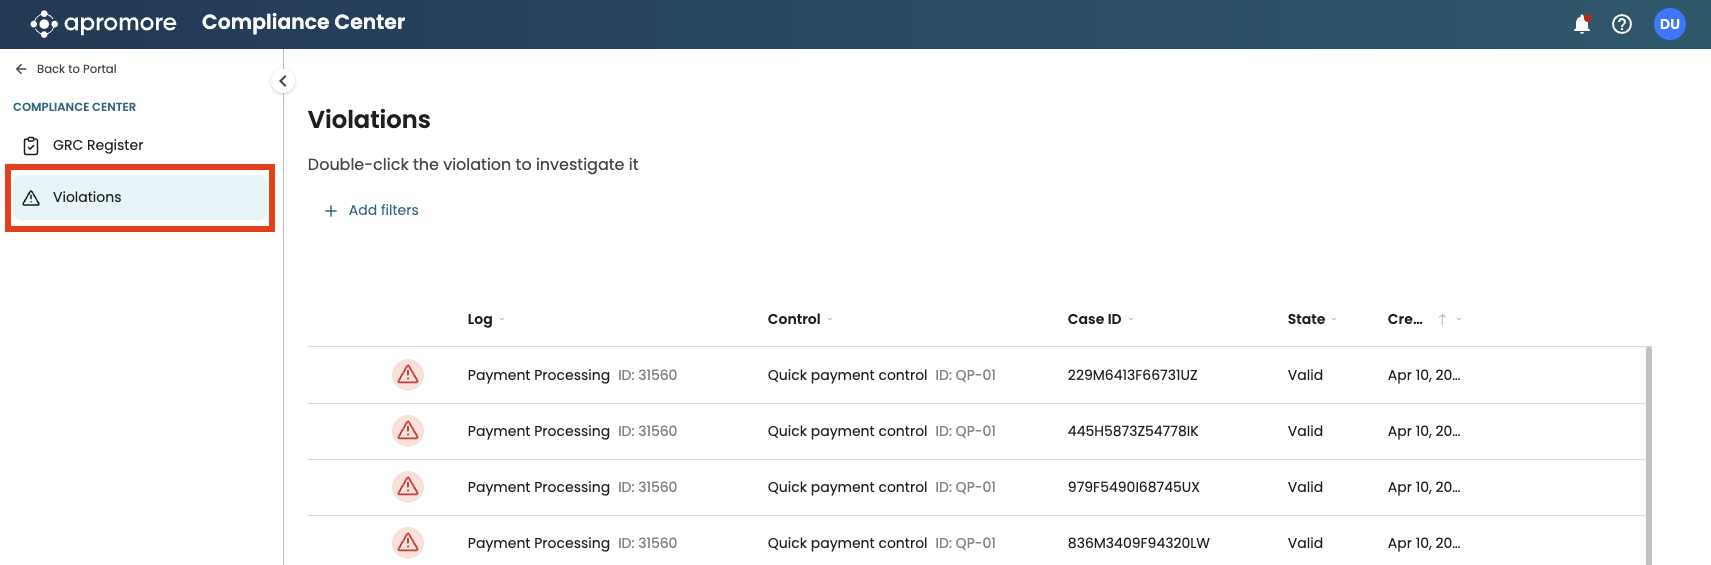
We can see the cases where the control is violated in the Violations page, as shown below.
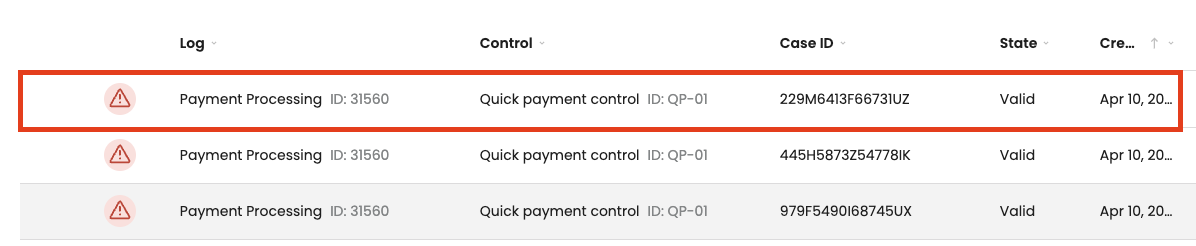
To investigate a violating case, double-click on the corresponding row.
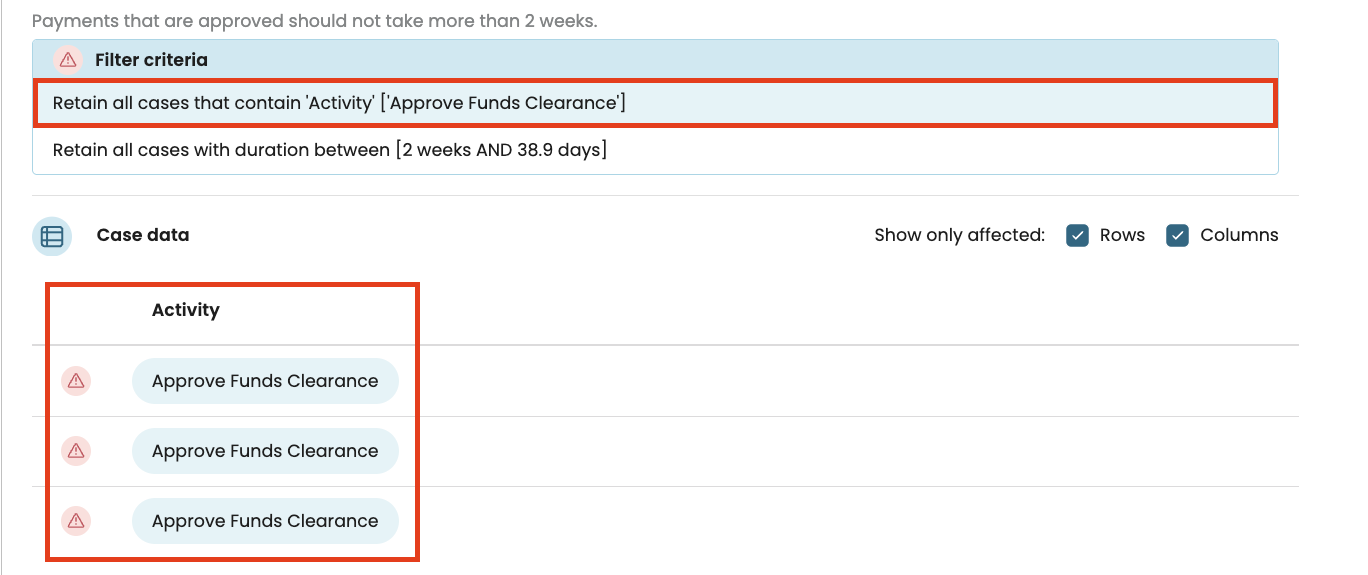
This opens the Case investigation page. Here, we see: (1) the filter criteria associated with the control; and (2) A table listing the events in the violating case.
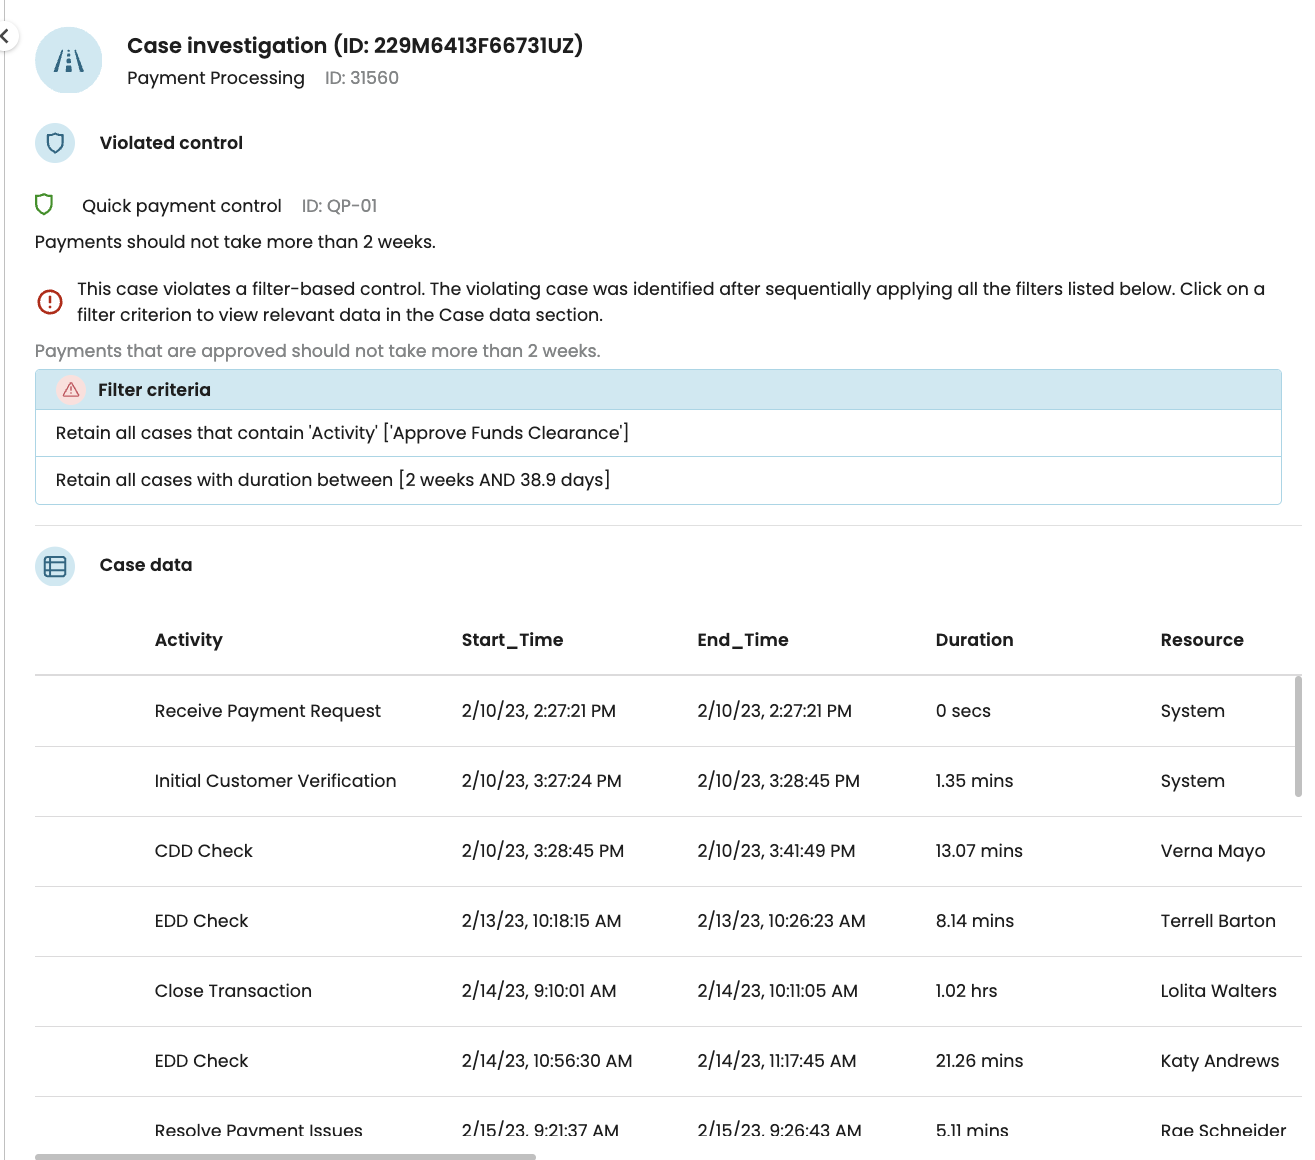
When we select a filter criterion, the table displays only events that fulfil this criterion. For example, when we click on the first criterion (retain cases that contain “Approve Funds Clearance”), the table only displays events that fulfill this criterion.
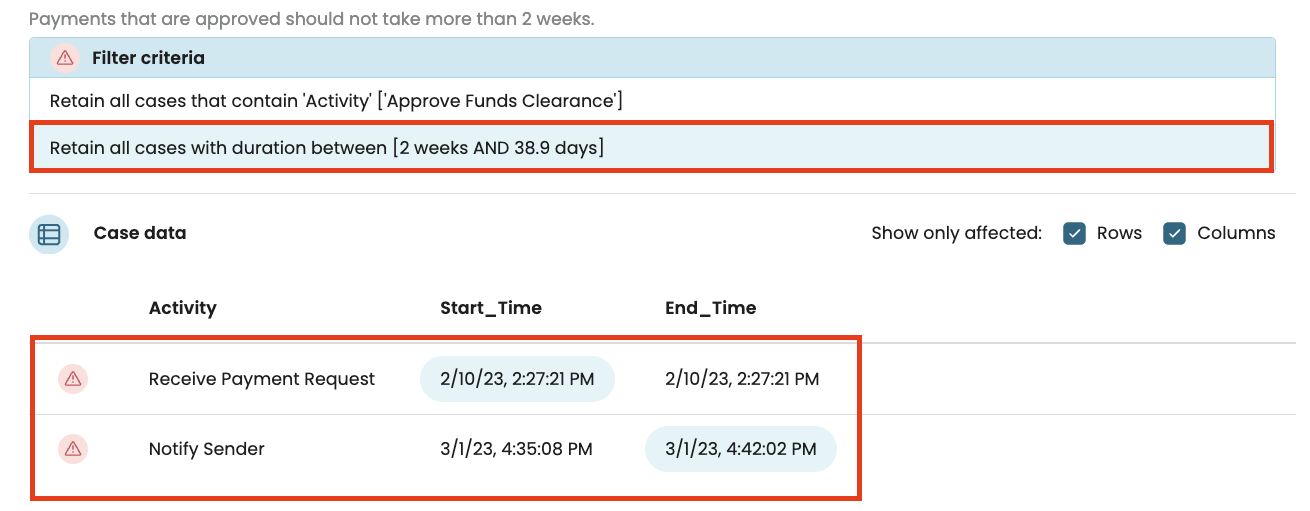
Let’s now select the second filter criterion. In this case, the case data highlights the “Start timestamp” of the first activity and “End timestamp” of the last activity to highlight that the case took more than 2 weeks (which is why the control was violated).
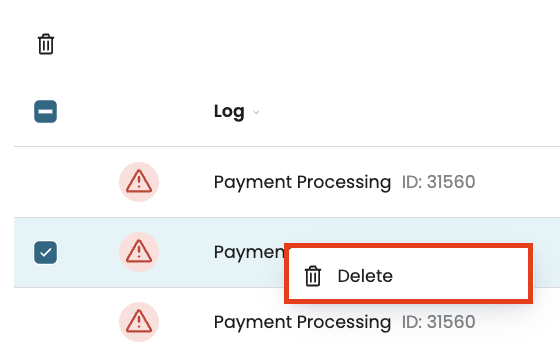
Delete violations
We can delete violations in the Violations page. To do so, right-click on the violation and select Delete, or click on the delete icon in the toolbar.