Manage KPIs
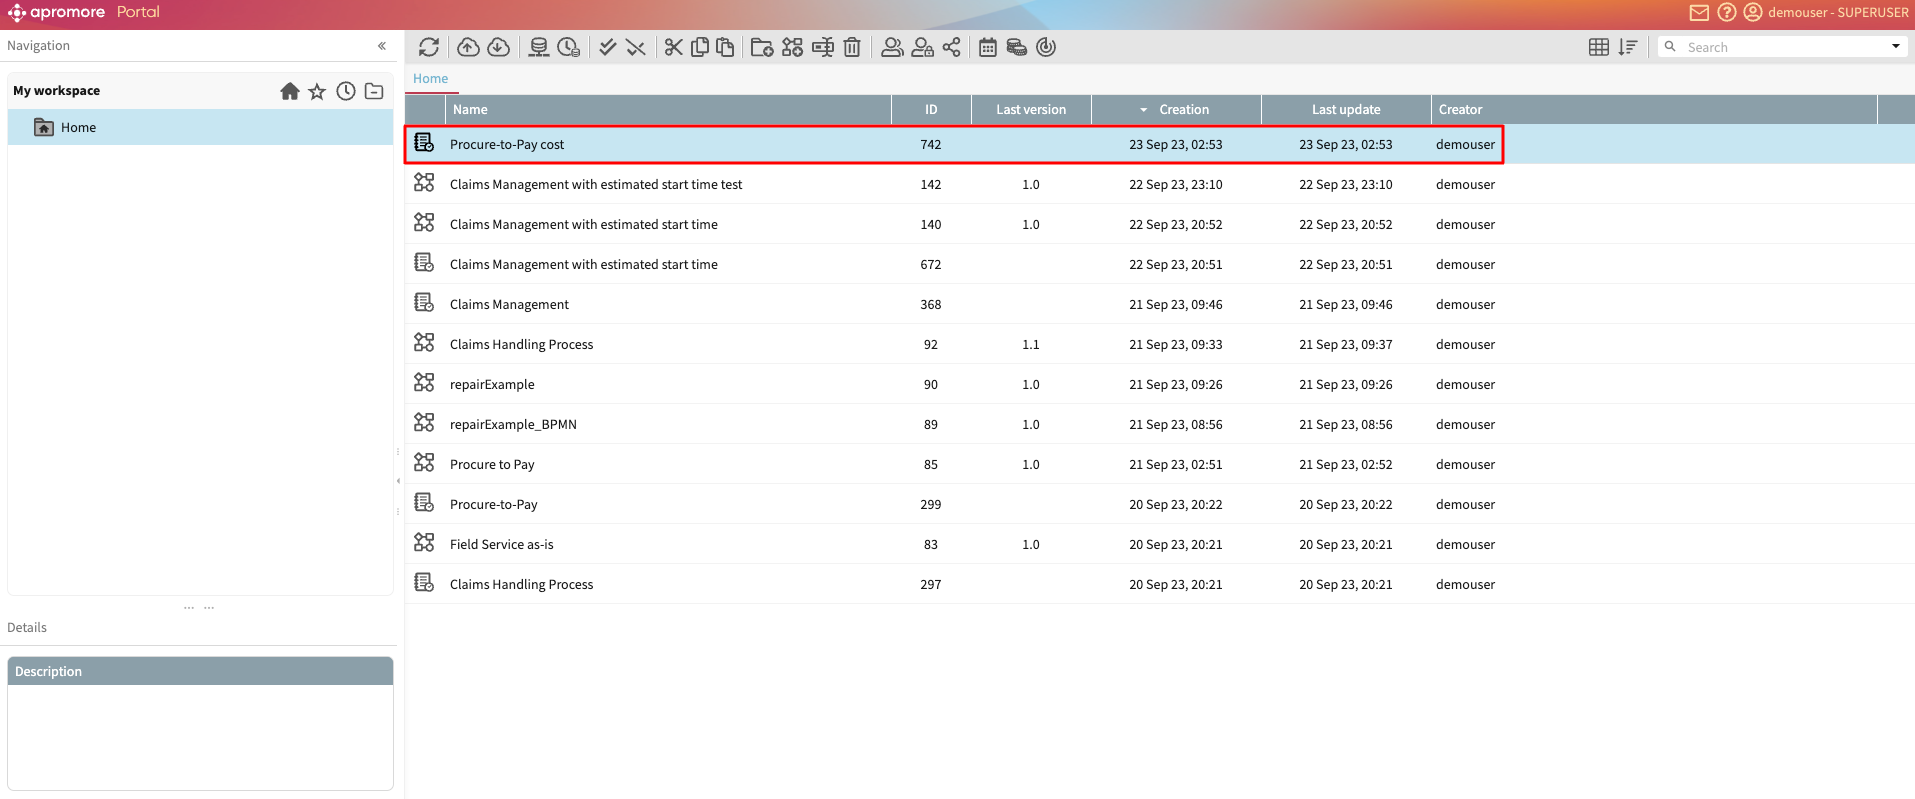
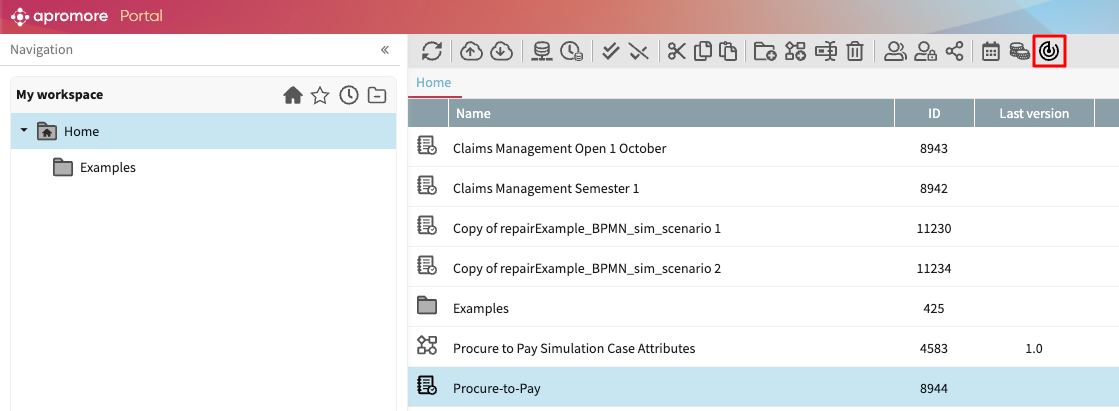
Apromore allows us to create and manage KPIs on an event log, which can be used to track SLA breaches in a process. To create a KPI in Apromore, go to Portal. Click the event log we’d like to create the KPI for.
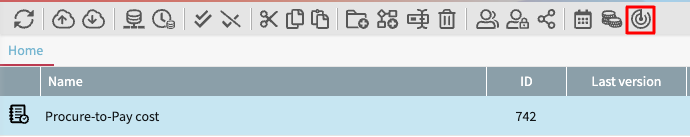
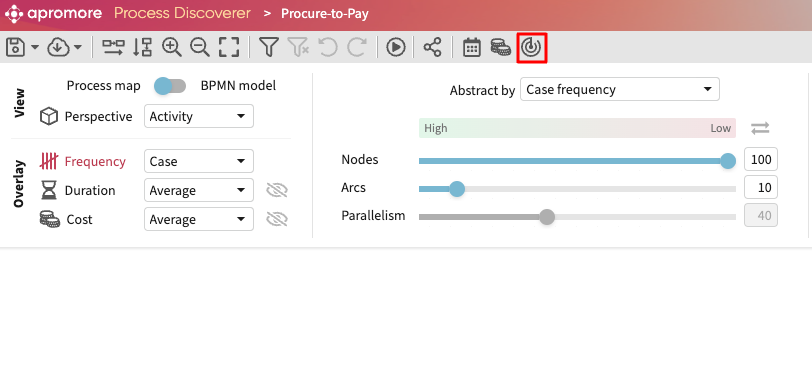
Click the Manage KPIs icon  .
.
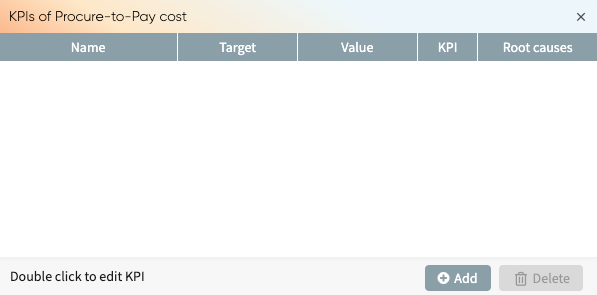
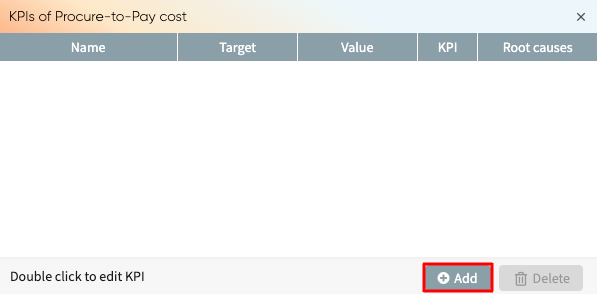
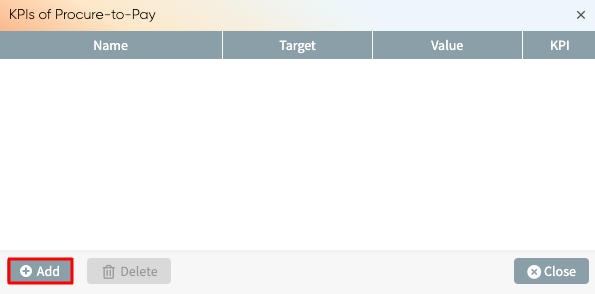
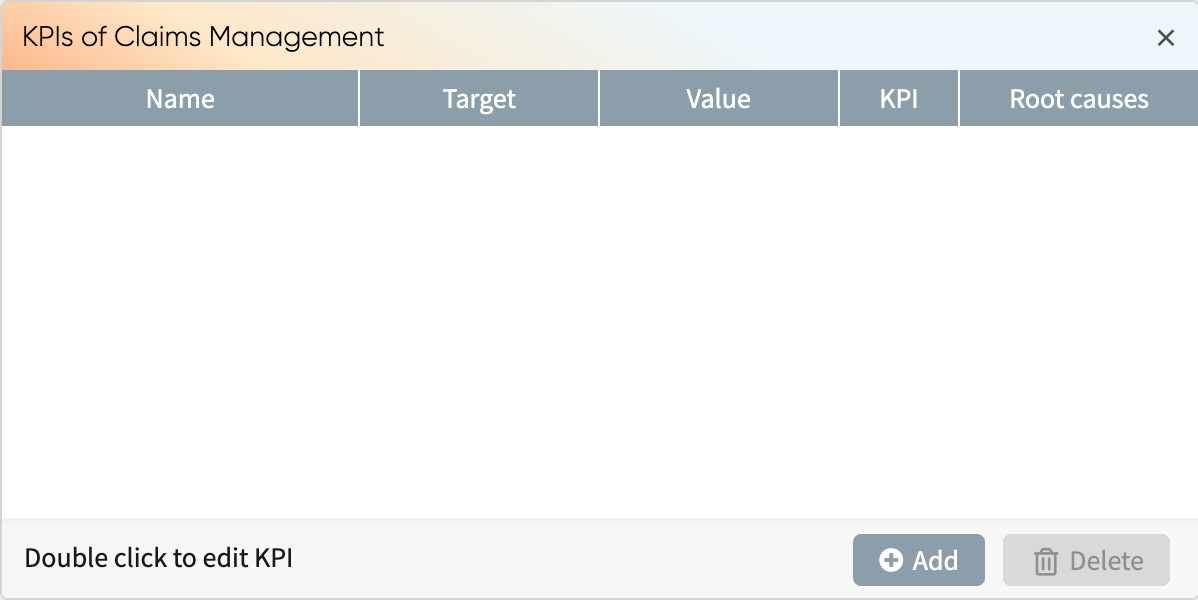
The KPIs attached to selected event log appears. If no KPI has been added to this log, the KPI window appears empty.
To add a new KPI click Add.
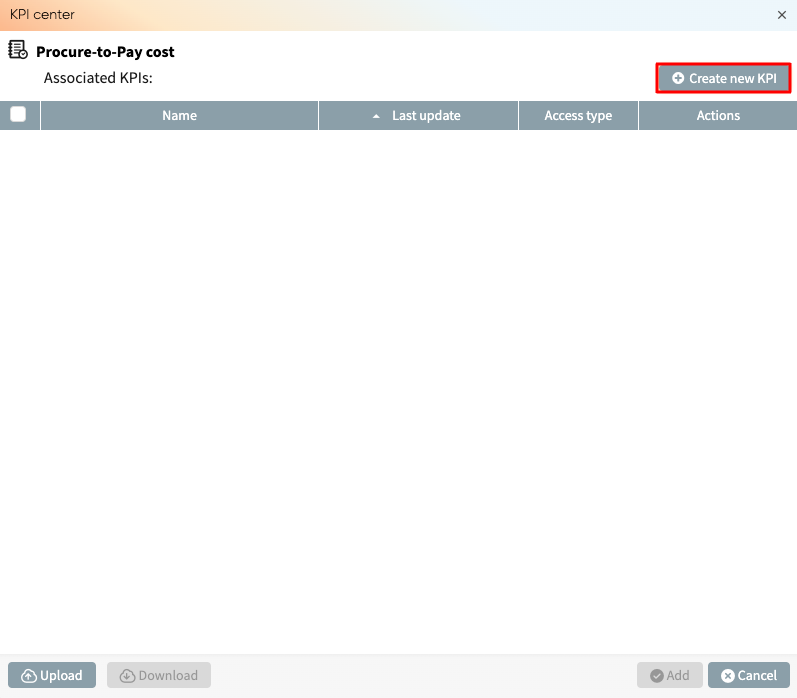
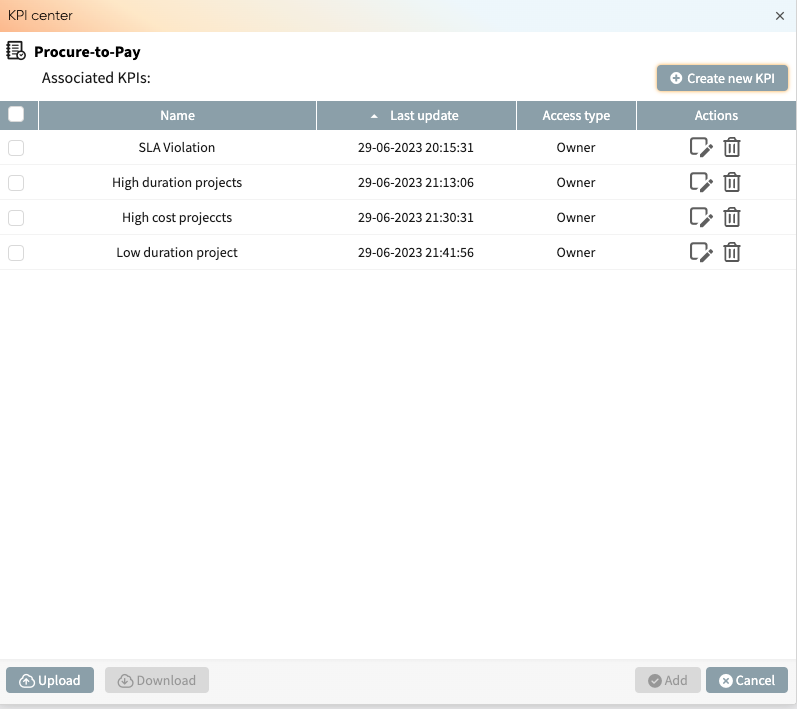
The KPI center window appears containing existing KPIs associated with the event log.
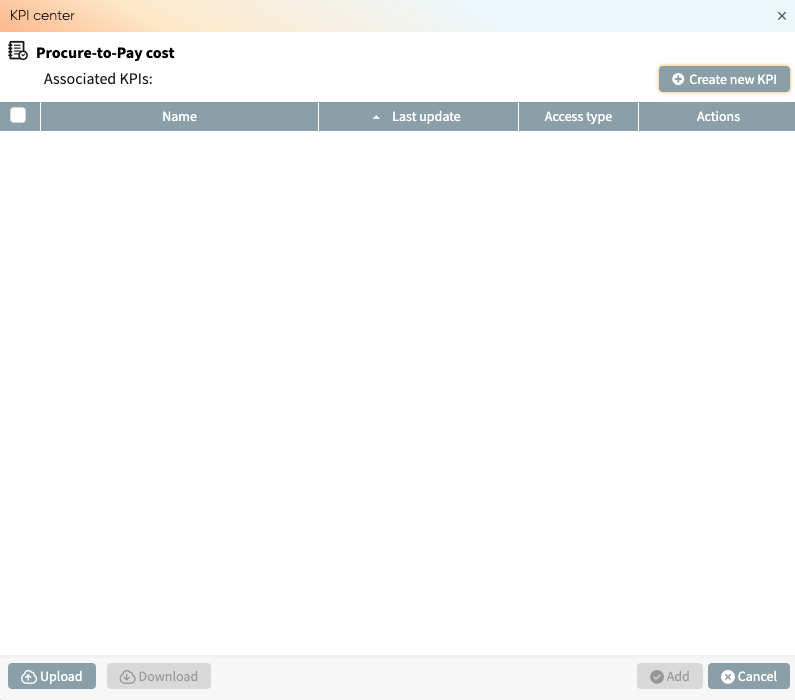
Click Create new KPI.
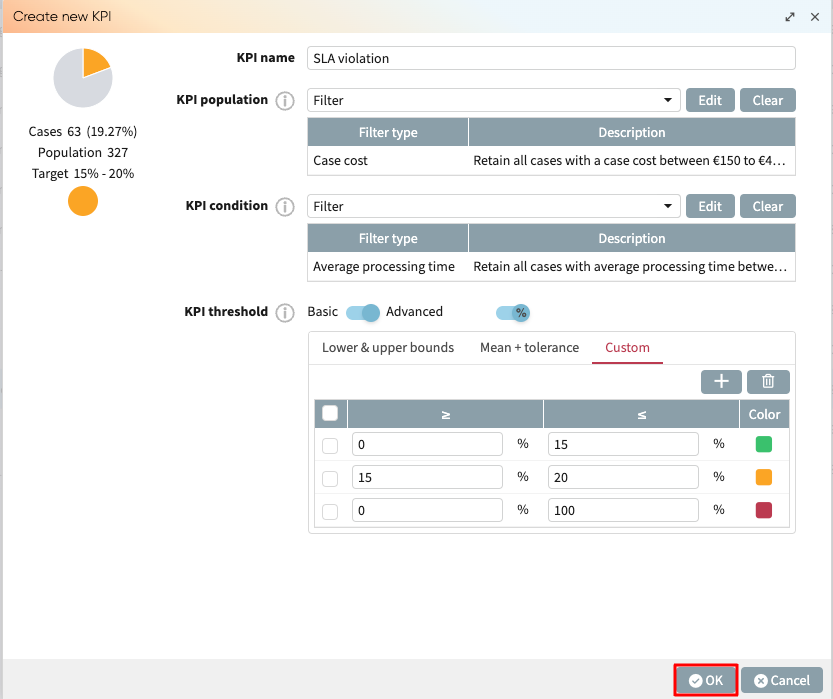
The Create new KPI window is displayed.
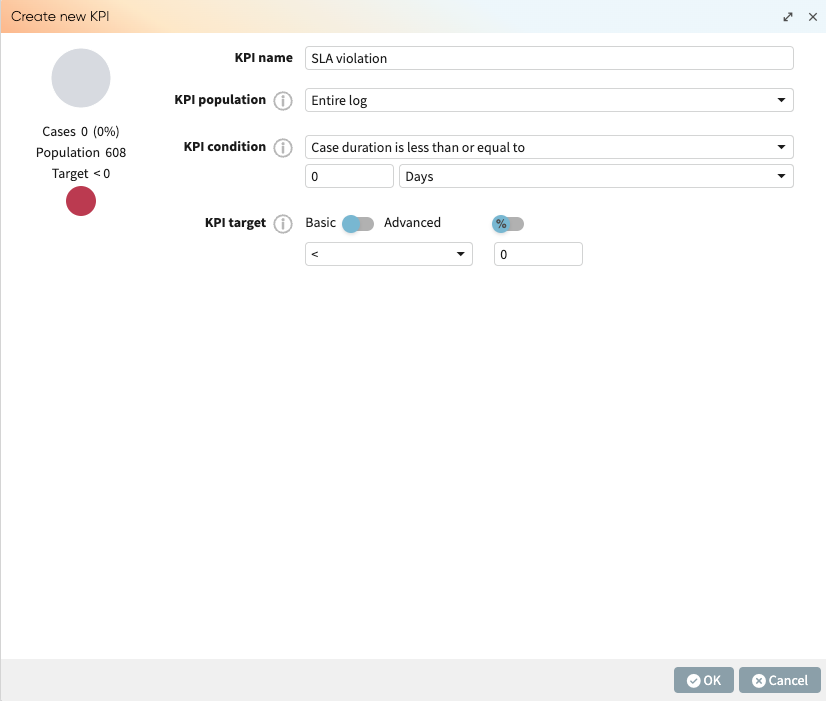
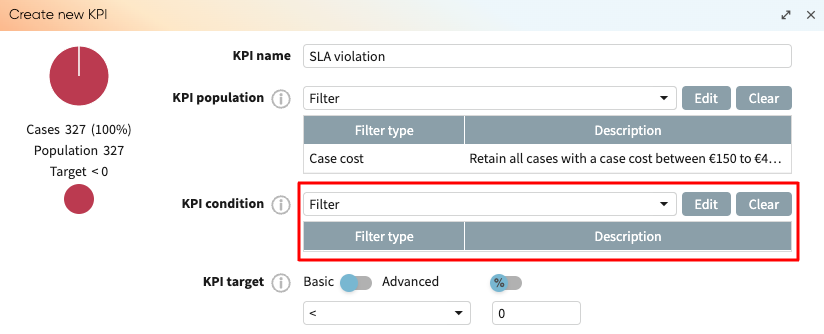
For a KPI to be successfully created, we need to define the KPI name, KPI population, KPI condition, and KPI target.
Enter a KPI name. This name would be used for future reference to the KPI. We can call it SLA violation.
Specify the KPI population
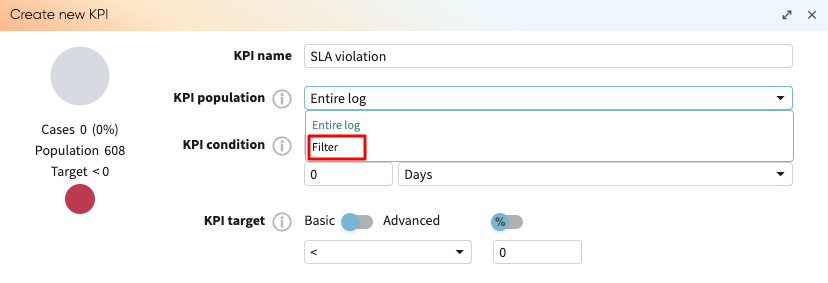
The KPI population defines the subset of logs the KPI condition will apply to. By default, the KPI population is set to Entire log. This means that the KPI condition will apply to the entire log.
We can, however, apply the KPI condition on a subset of the log. For example, if we wish to track only high cost cases, we can set the KPI to apply on a subset of the log where the case cost is more than 150 EUR. To do that, click on the dropdown next to KPI population. Select Filter.
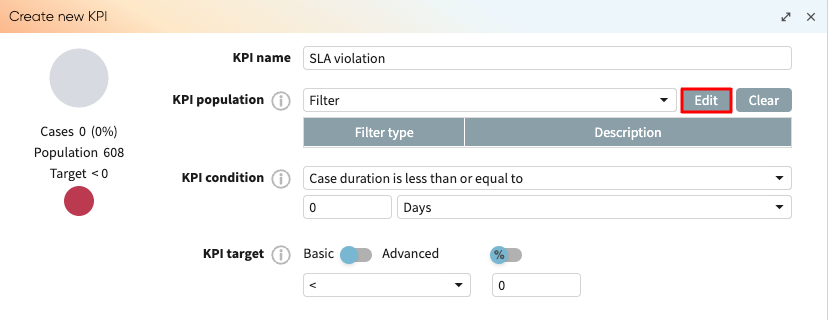
Click Edit to add the filter.
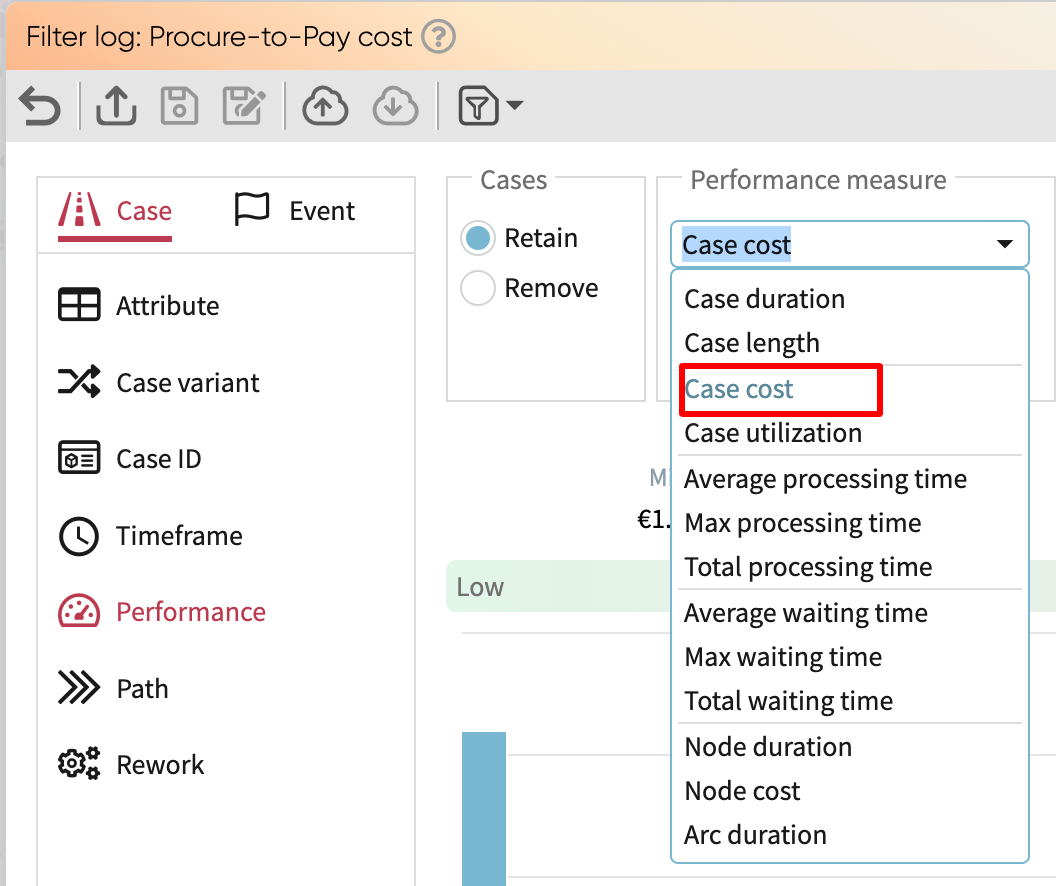
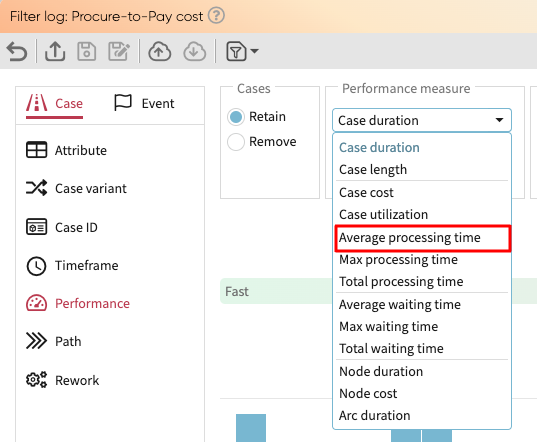
The Filter log window appears. To create the filter, go to the case Performance tab. In the Performance measure dropdown, select Case cost.
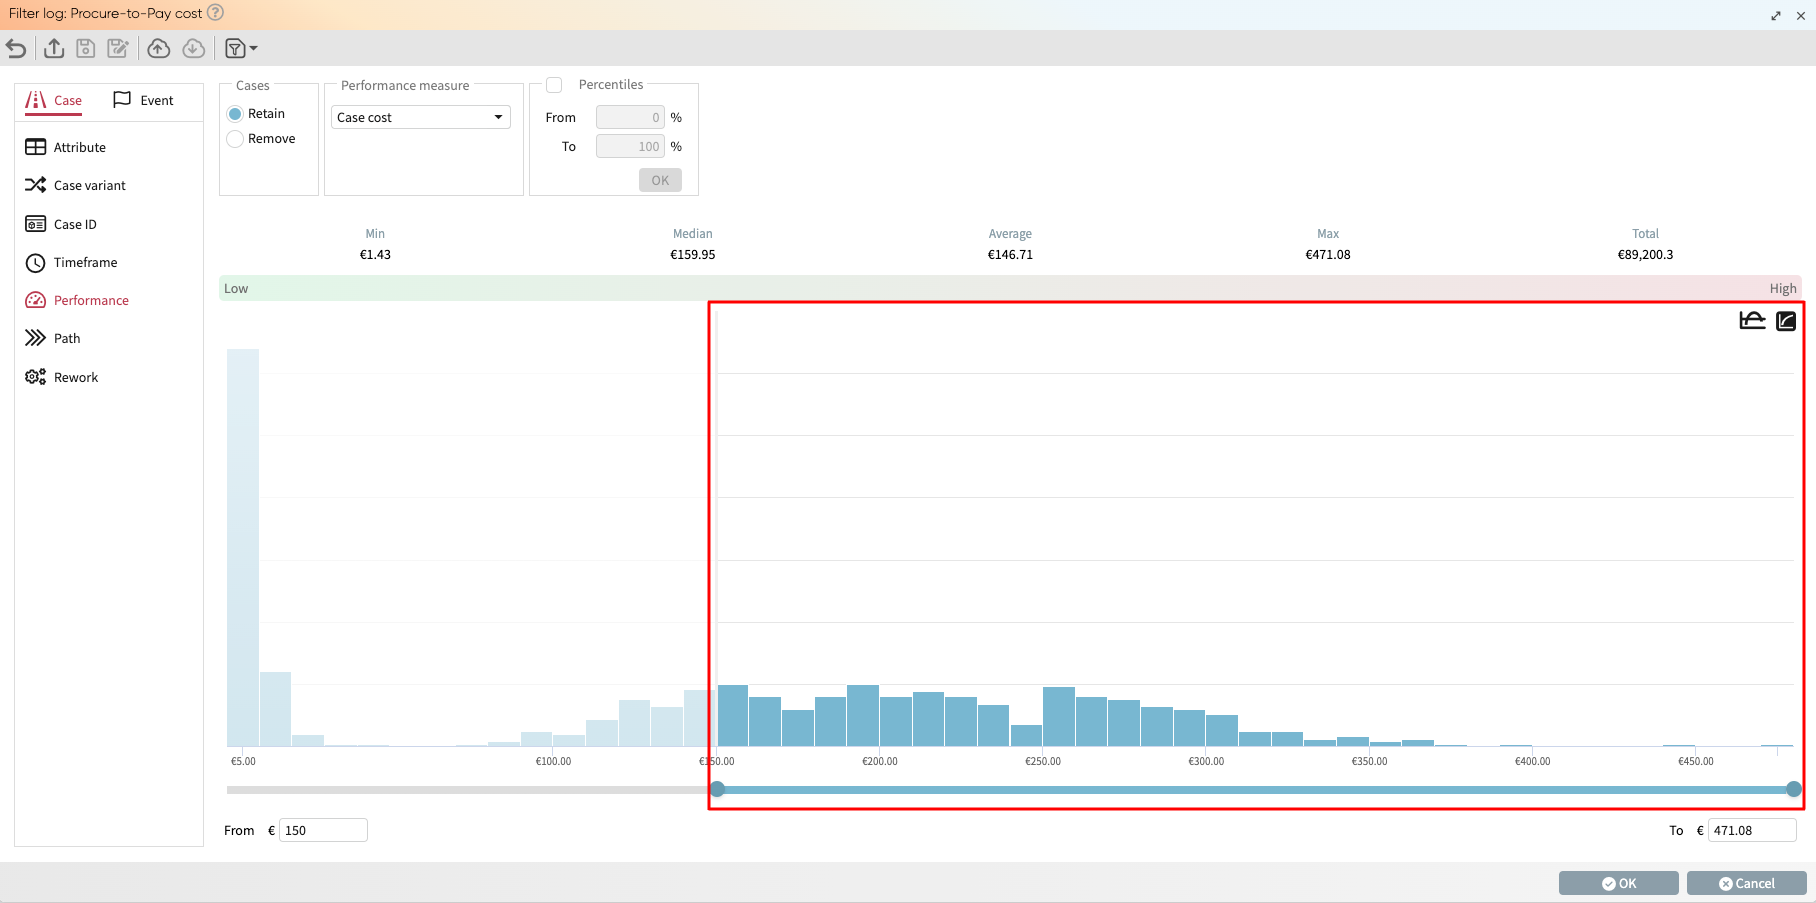
We can use the slider to select cases whose cost is greater than 150 EUR. Click OK.
The filter is applied as the KPI population.
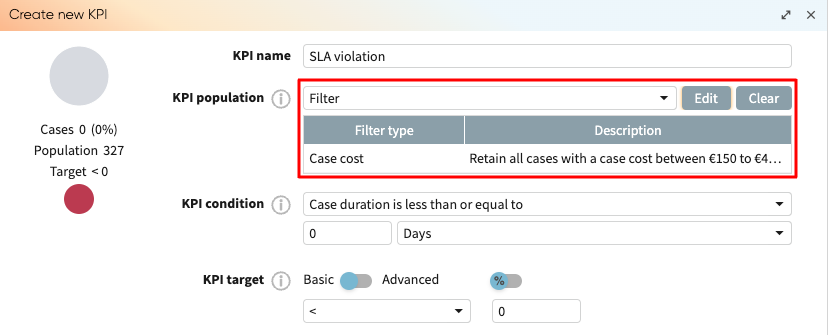
We can edit the filter by clicking Edit or completely delete the filter by clicking Clear.
Specify the KPI condition
The KPI condition is the SLA violation we wish to track. To specify the KPI condition, click the dropdown next to KPI condition.
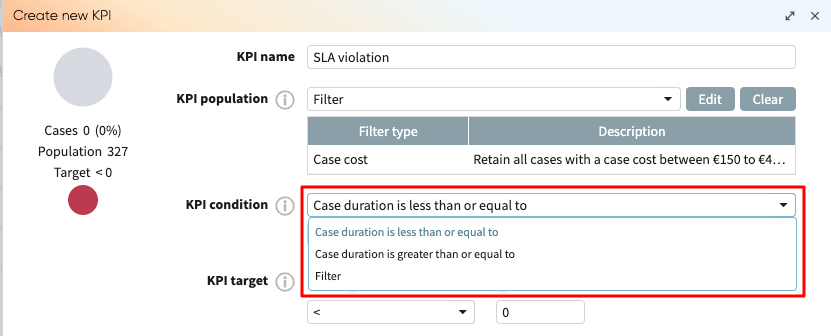
If we wish to track cases where the case duration is greater than a specific value, say 90 days, we specify it using the dropdown. The KPI condition could be Case duration is less than or equal to, Case duration is greater than or equal to, or Filter.
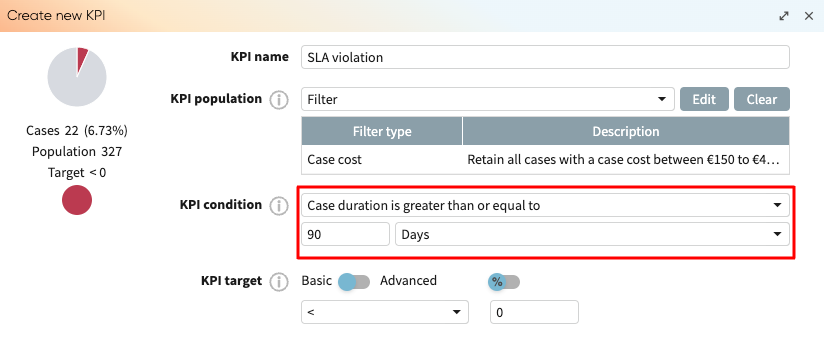
In our case, we choose Case duration is greater than or equal to. Enter 90 as the value, and click Days from the dropdown.
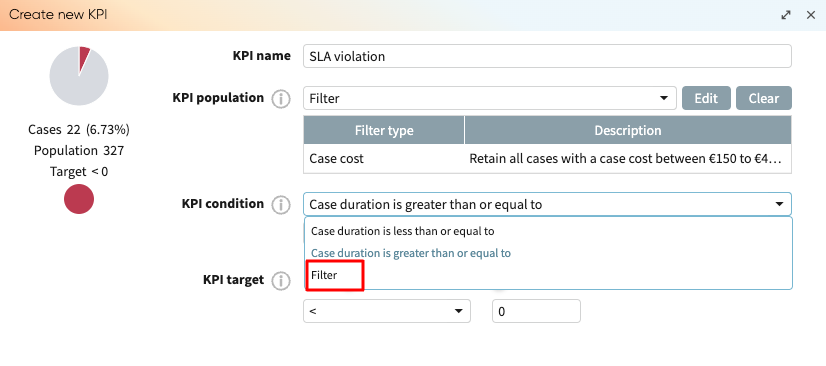
We can also create a more customized KPI condition using filters. To create a KPI condition with filters, click Filter from the dropdown.
The KPI condition now displays existing filters that can be edited or cleared. If no filter has been created, the Filter type and Description appear empty.
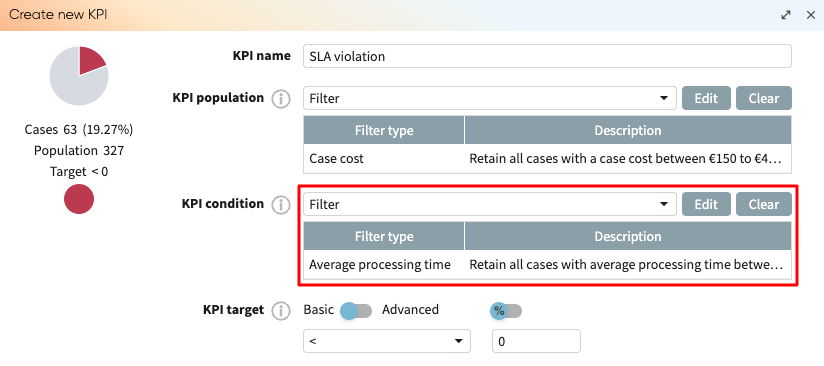
If for example, our SLA is to track only cases where the total processing time took more than 2 hours. We can create this filter as the KPI condition. To create a filter, click Edit. The Filter log window pops up.
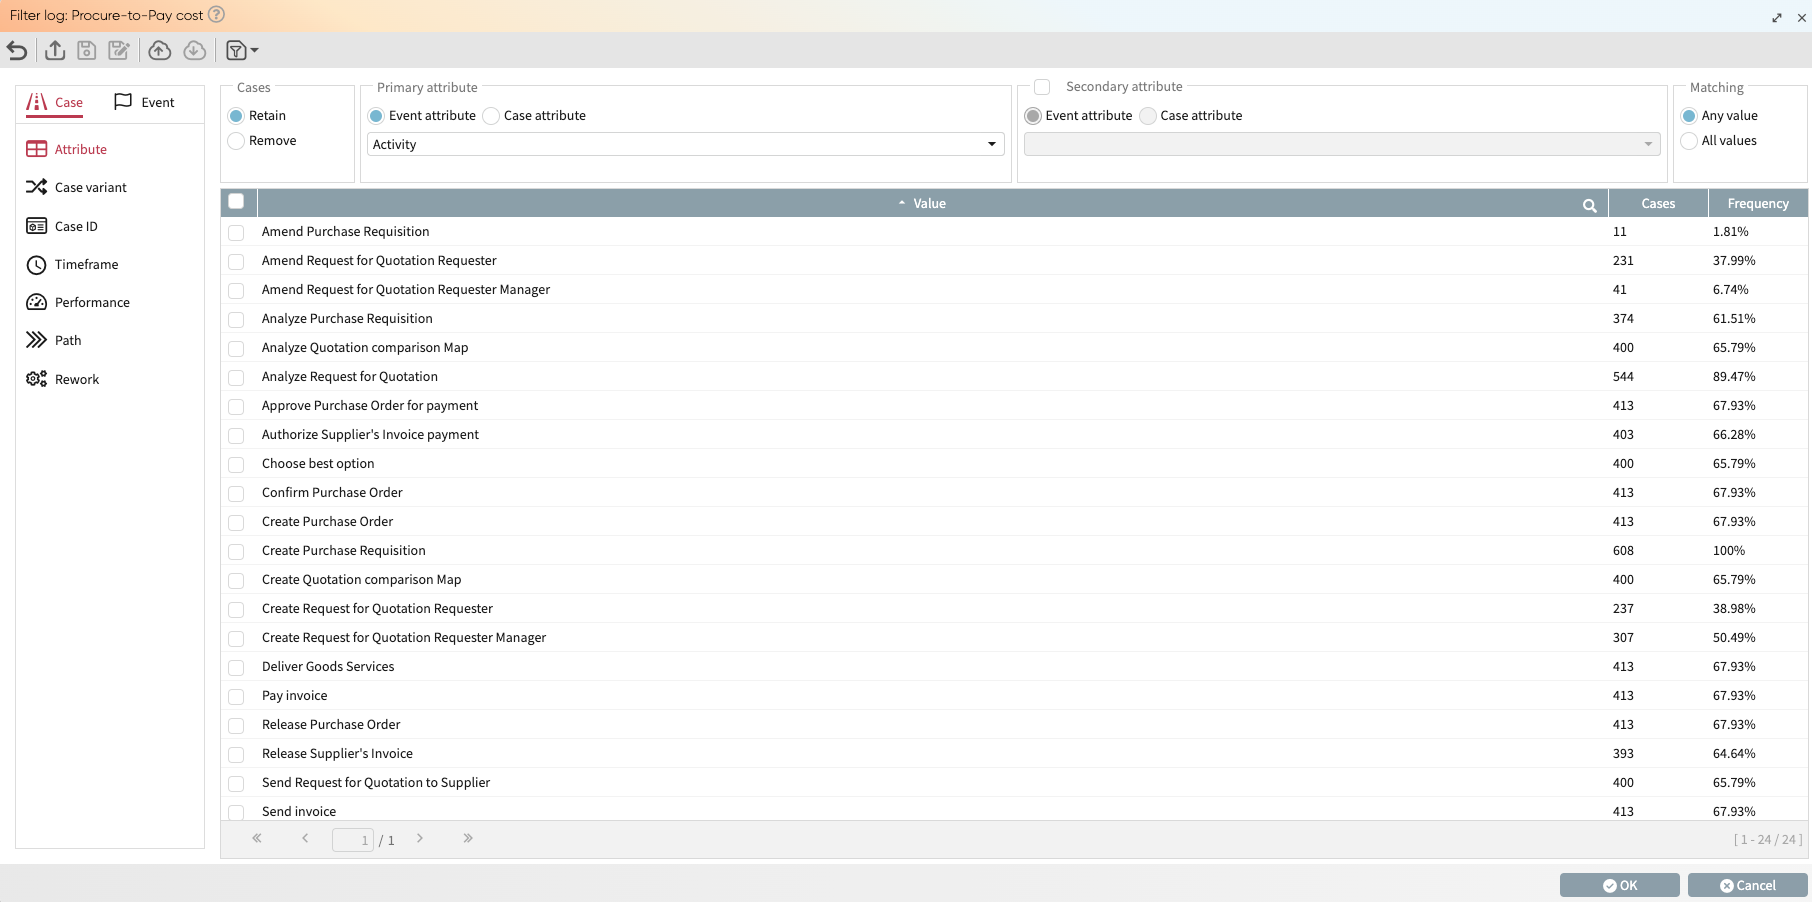
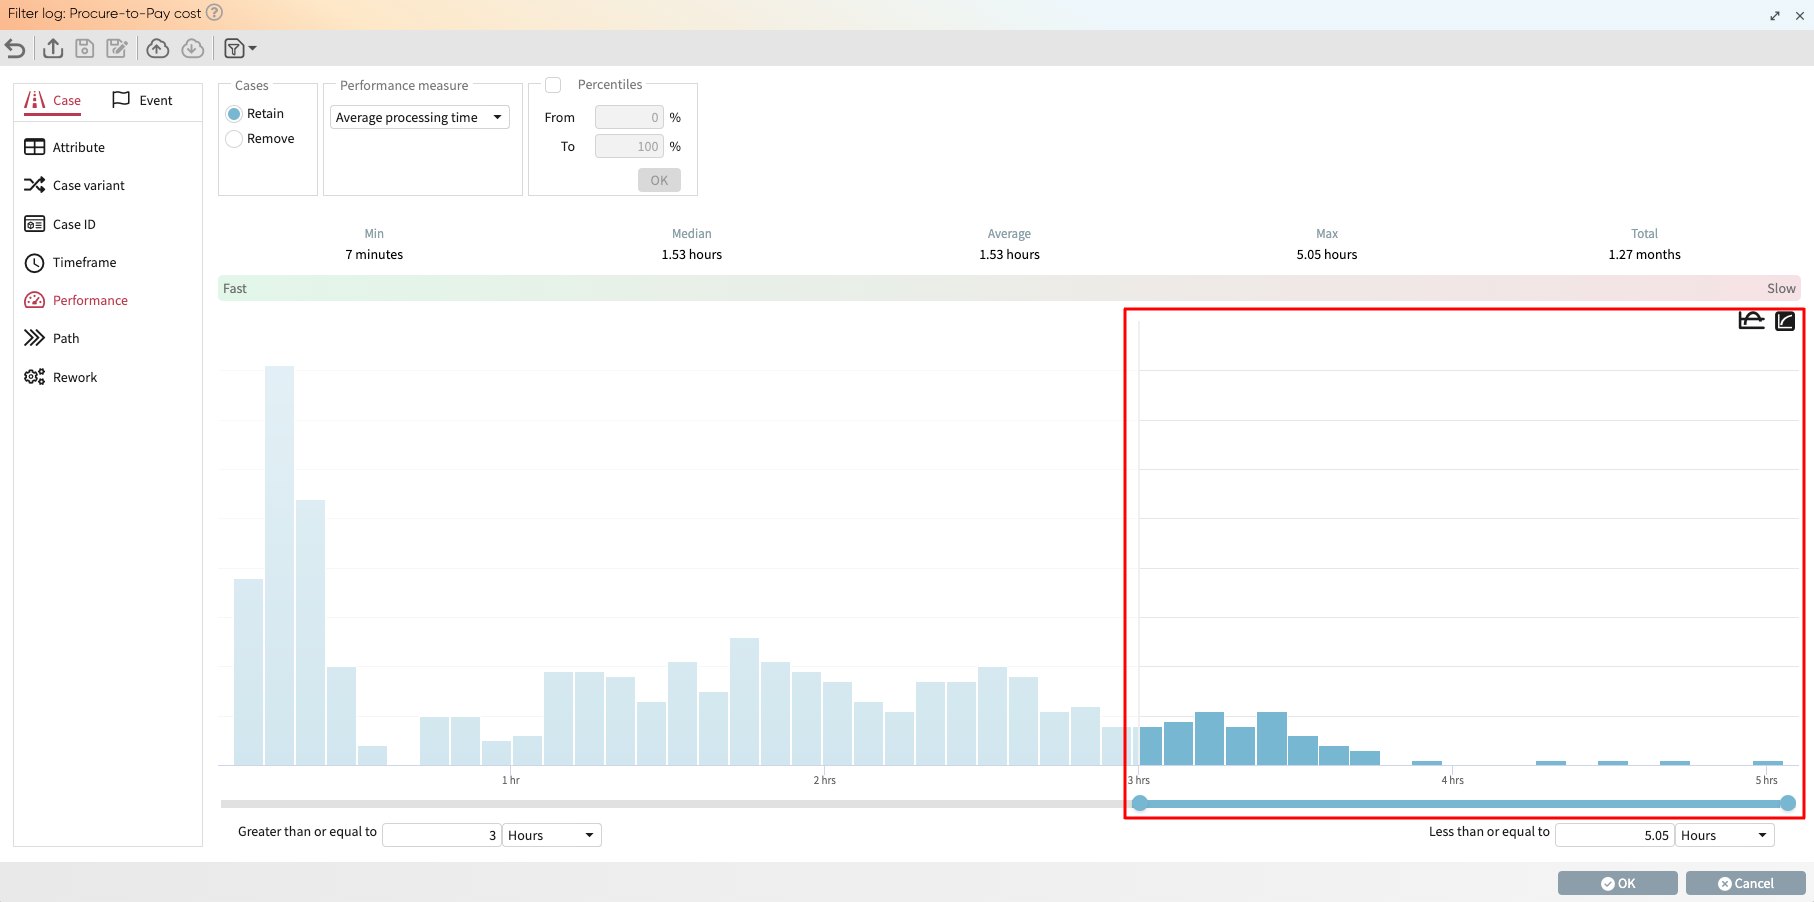
To create the filter, go to the case Performance tab. From the performance measure dropdown, select Average processing time.
Use the slider to select cases between 3 hours and the maximum (5.05 hours). Click OK.
If we wish to create another filter, click the “+” button in the top left corner and specify the new one.
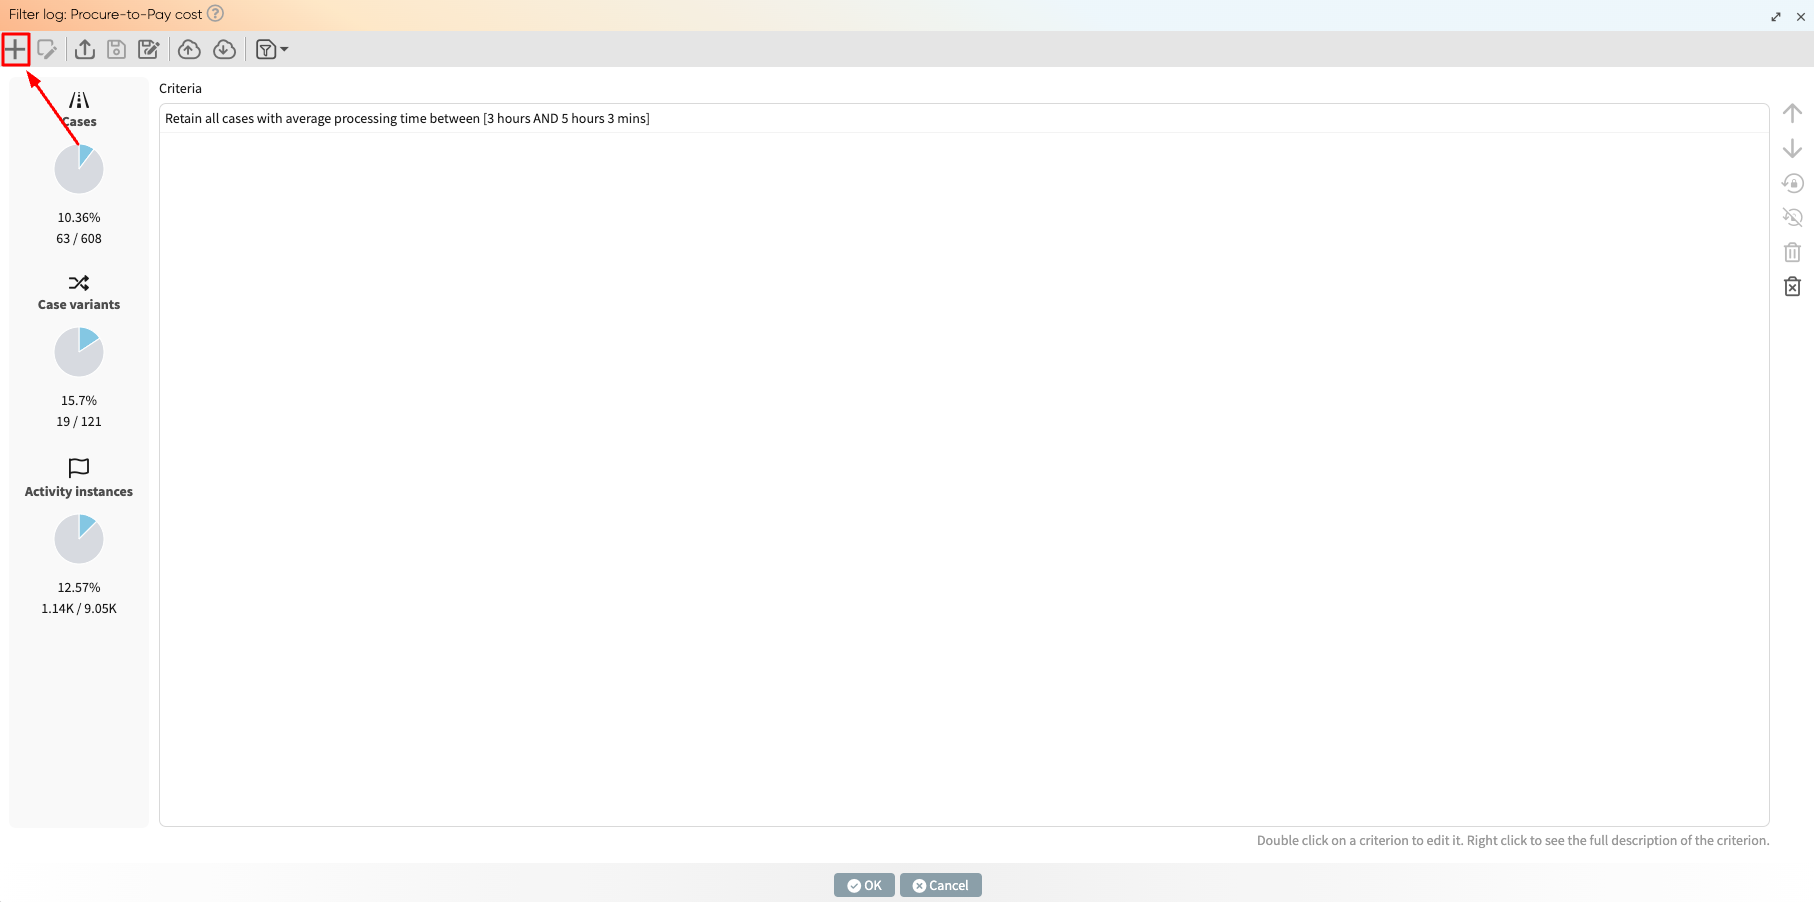
Once we have created the filter(s) that satisfies the SLAs, click OK.
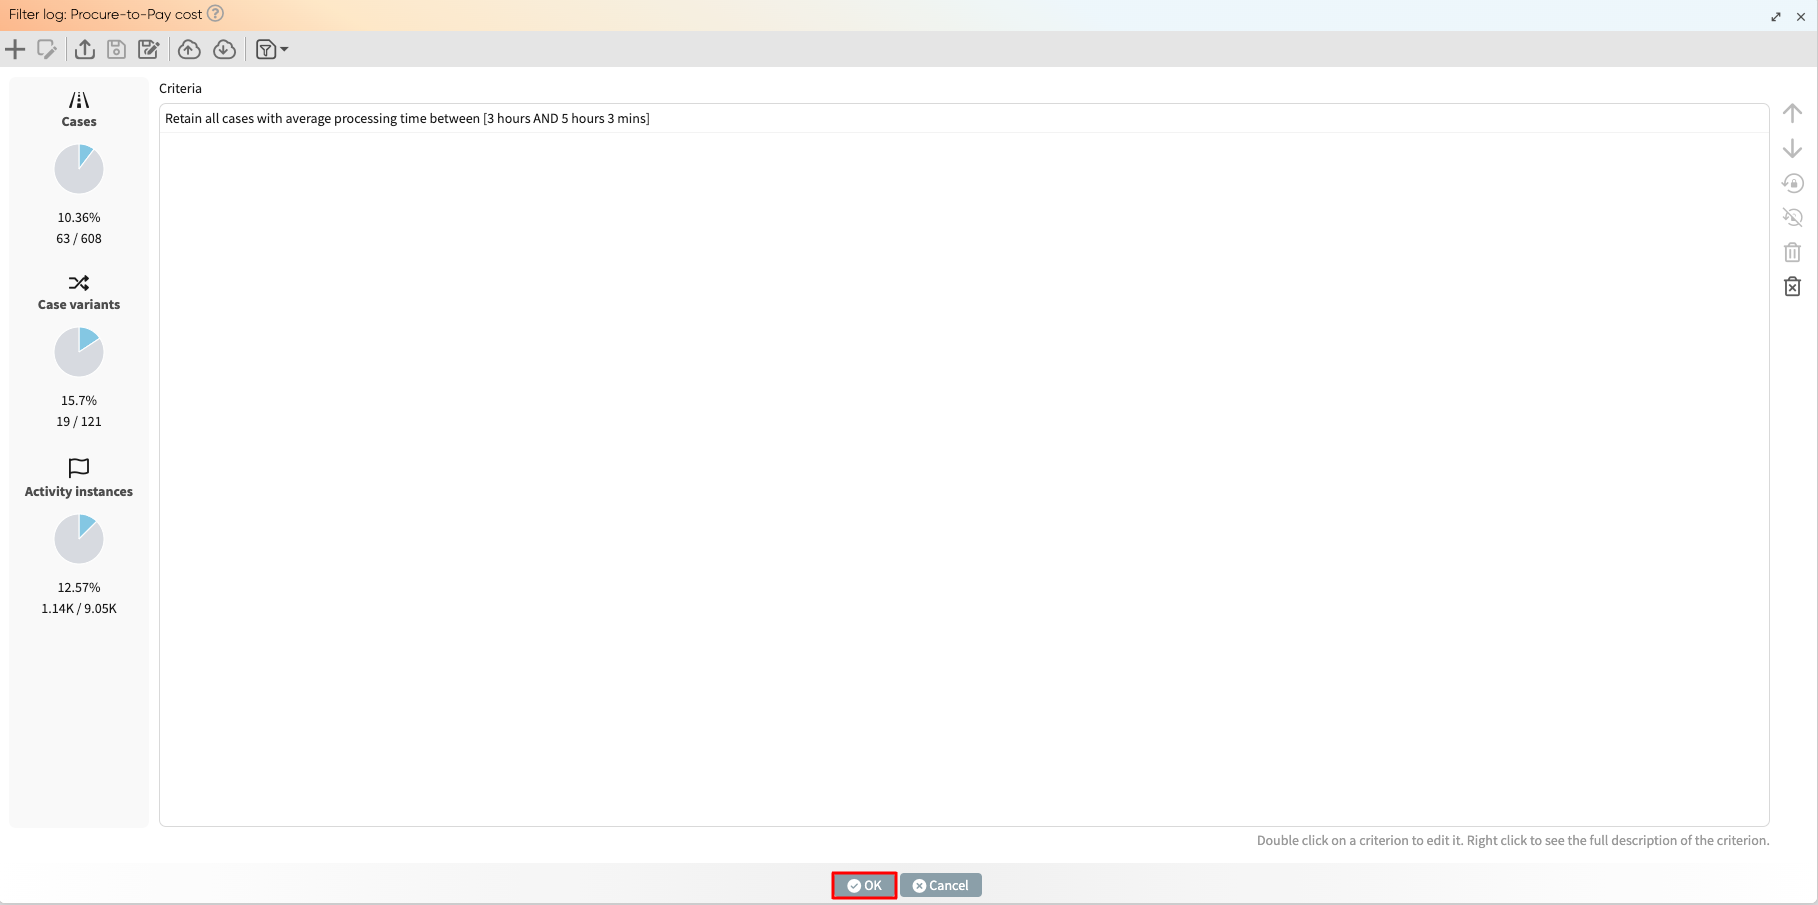
The filter(s) will be applied as the KPI condition.
We can edit the filter by clicking Edit or completely delete the filter by clicking Clear.
Specify the KPI target
The KPI target defines the permissible threshold for which the KPI will be triggered. We can specify the KPI target using the basic or advanced settings.
Define a basic KPI target
By default, the KPI target is set to Basic. In Basic, we can only set a target (also called a threshold) for triggering the KPI. When the threshold is exceeded, the KPI is triggered with color red, indicating an SLA violation exists. When the threshold is not exceeded, the KPI is triggered with color green, indicating no SLA violations.
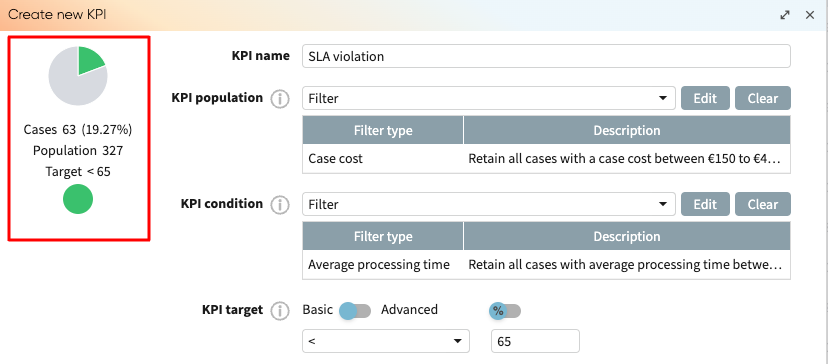
For example, we may want the KPI to appear green when the number of cases that fulfill the KPI condition is less than 65. Otherwise, appear red.
To do this, ensure the switch is at Basic, and the percentage switch  is turned off.
When the percentage switch is turned off, values are considered as numbers not percentages.
is turned off.
When the percentage switch is turned off, values are considered as numbers not percentages.
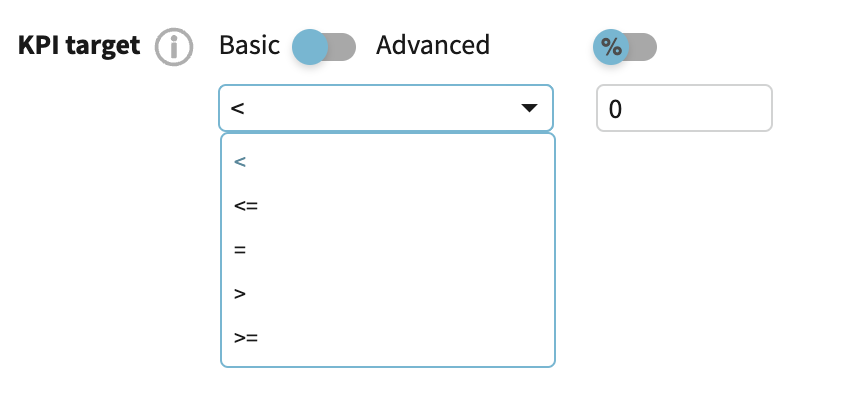
In the dropdown, we may select less than (<), less than or equal to (<=), equal to (=), greater than (>), or greater than or equal to (>=). In our case, we select less than (<).
In the text box, enter the value. We enter 65.

The KPI appears green because the number of cases that satisfy the KPI is 63. The set threshold (65) has not been reached.
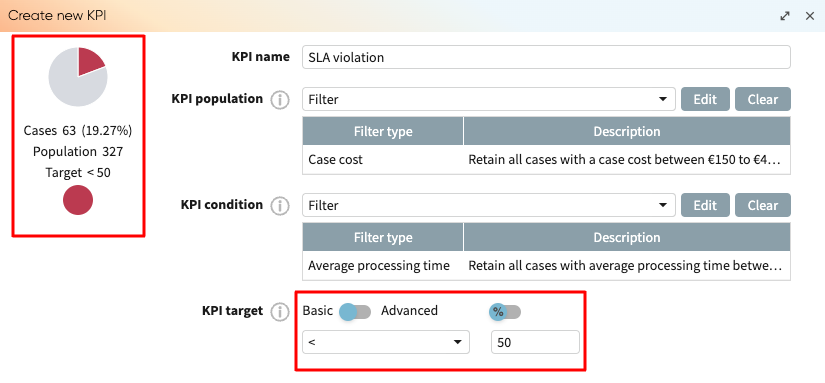
If we reduce the threshold to 50, the KPI will be triggered with red because this time, the threshold has been exceeded.
We may also set the threshold by percentage and not value. To do this, toggle on the percentage switch  .
Assuming a threshold of 20%, enter 20 in the text box.
.
Assuming a threshold of 20%, enter 20 in the text box.
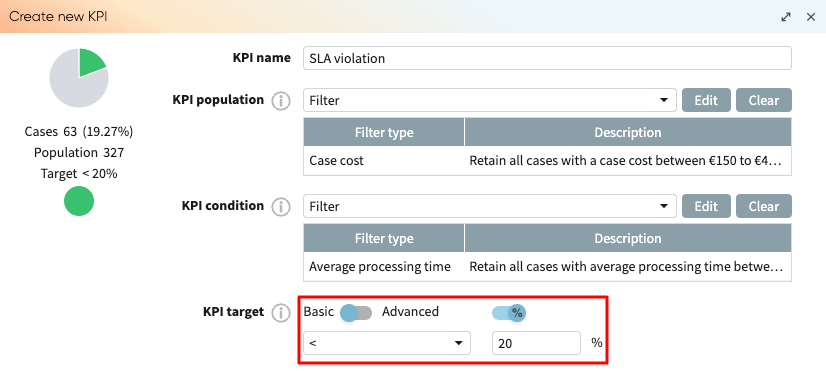
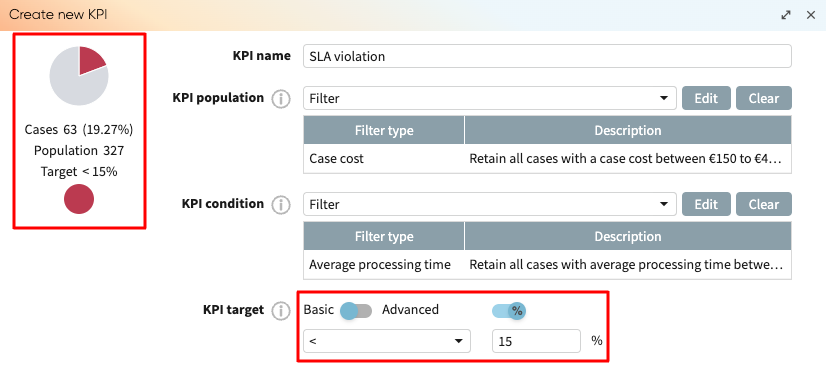
Here, we see the KPI is green because 19.27% of the cases fulfill the KPI condition, which is less than the 20% set. If, for instance, we reduced the threshold to 15%, the KPI would turn red.
Define an advanced KPI target
We can customize the KPI target more by switching to the Advanced mode. In the Advance mode, we can set Lower & upper bounds, Mean + tolerance, or a Custom KPI target.
1. Using Lower and Upper bounds
The lower and upper bounds allow us to define a range of thresholds rather than a single value. For instance, we may say if the percentage of cases that fulfill the KPI condition is between 10% and 15% (a range); the KPI should be triggered with green. To do so, switch to the Advanced mode and switch on percentages. Go to the Lower & upper bounds tab and enter the upper and lower bound percentages.
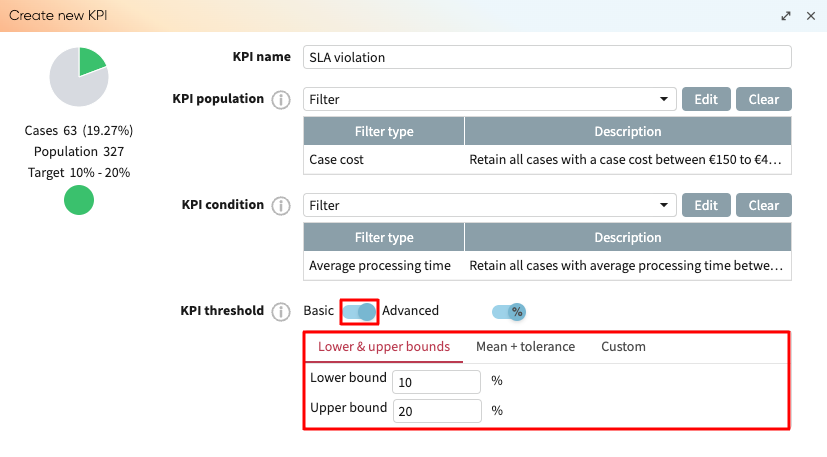
The KPI is green since the case is within the threshold (19.27%).
2. Using mean + tolerance
We may also define the KPI target using a mean value and some tolerance. For instance, we may restrict the threshold to be 20% with a tolerance of 10%. This means the range will be 20% - (10% of 20) and 20% + (10% of 20). That is a range of 18% to 22%.
To implement this, go to the Mean + tolerance tab. Enter 20 as mean and 10 as tolerance.
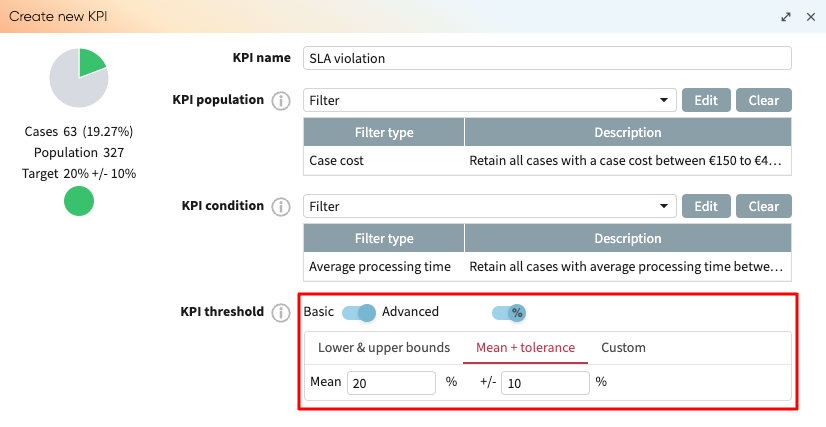
We see the KPI is green because 19.27% is greater than the lower bound of the tolerance (18%) and less than the upper bound of the tolerance (22%).
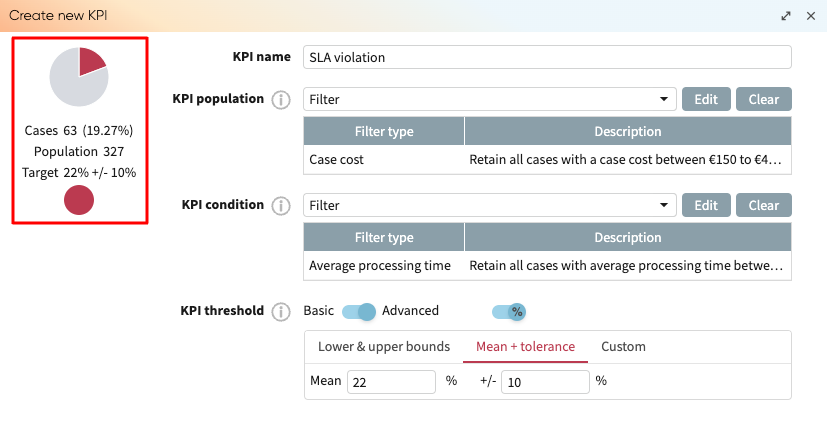
If we change the mean to 22%, leaving tolerance at 10%, the range becomes 19.8% to 24.2%.
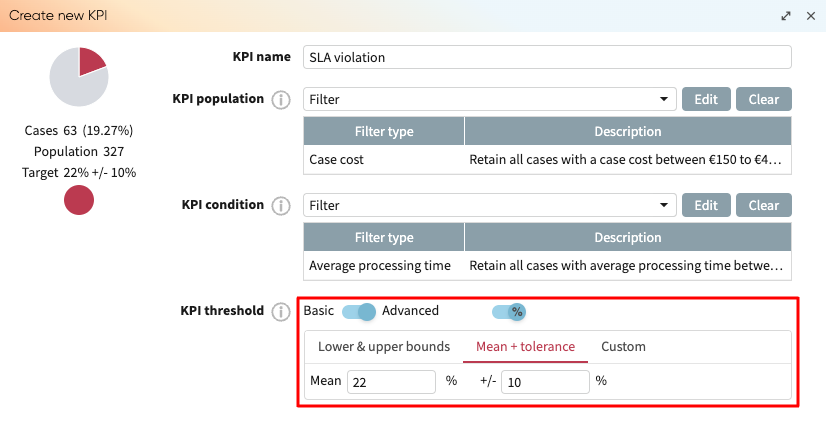
Since 19.27% does not fall in this range, the KPI is triggered with red.
3. Building a Custom KPI Threshold
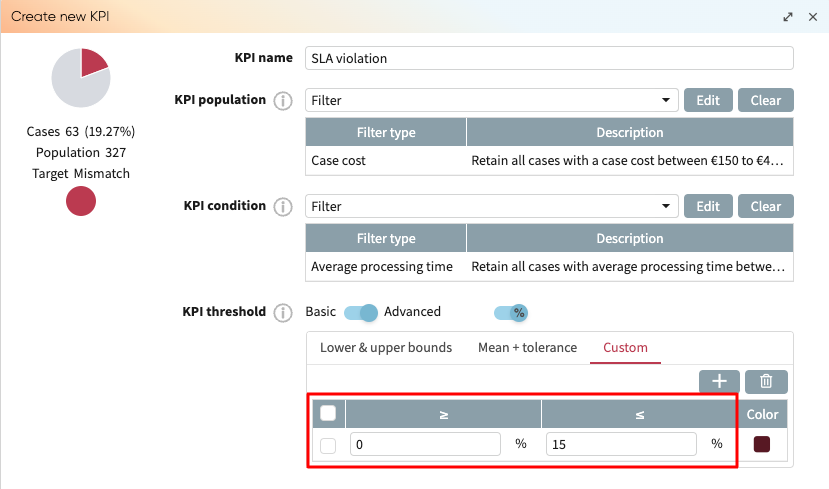
We can build a custom threshold that allows for more complexity to the upper and lower bounds and the associated color code. For instance, we may decide that the green color appears when the percentage is less than 15%. When it is between 15 to 20%, it is amber; when it is greater than 20%, it is red.
To do this, go to the Custom tab, and enter the ranges. For green, the range is between 0 to 15%.
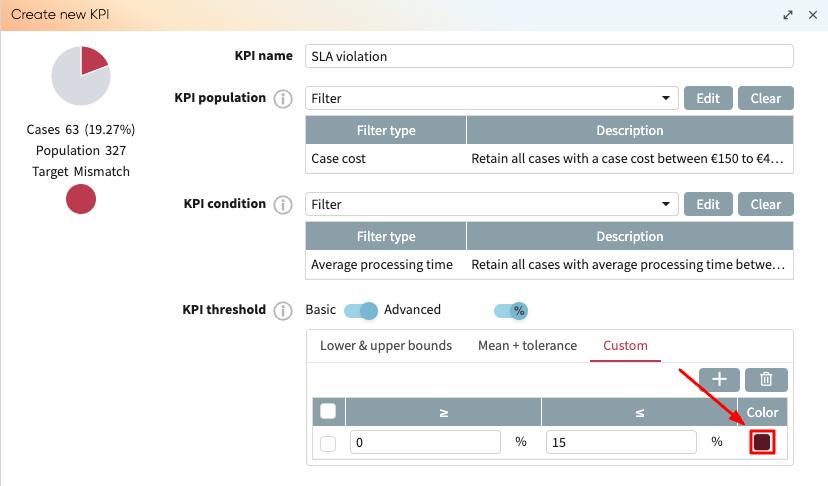
Click the color to change it.
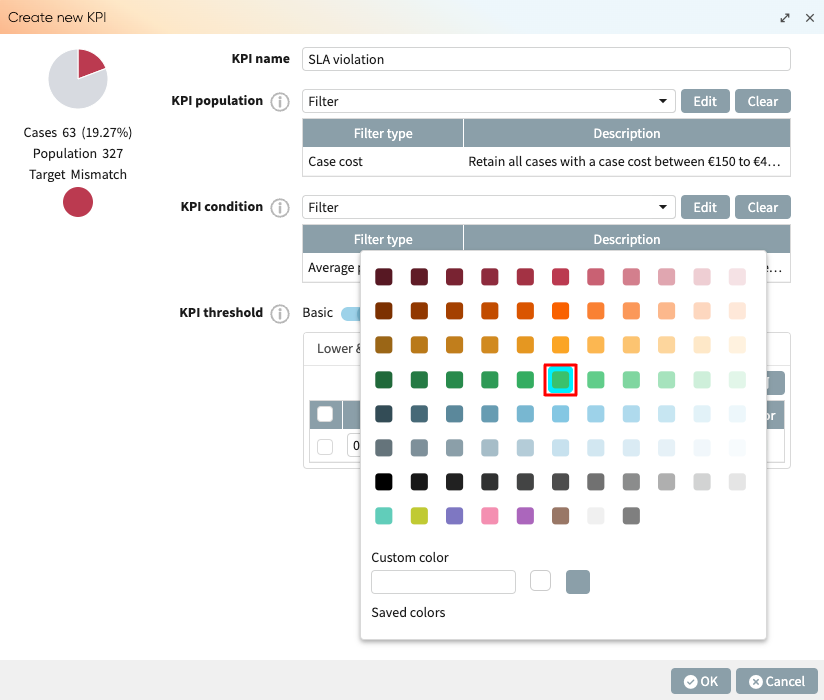
Choose from the required color from the color palette.
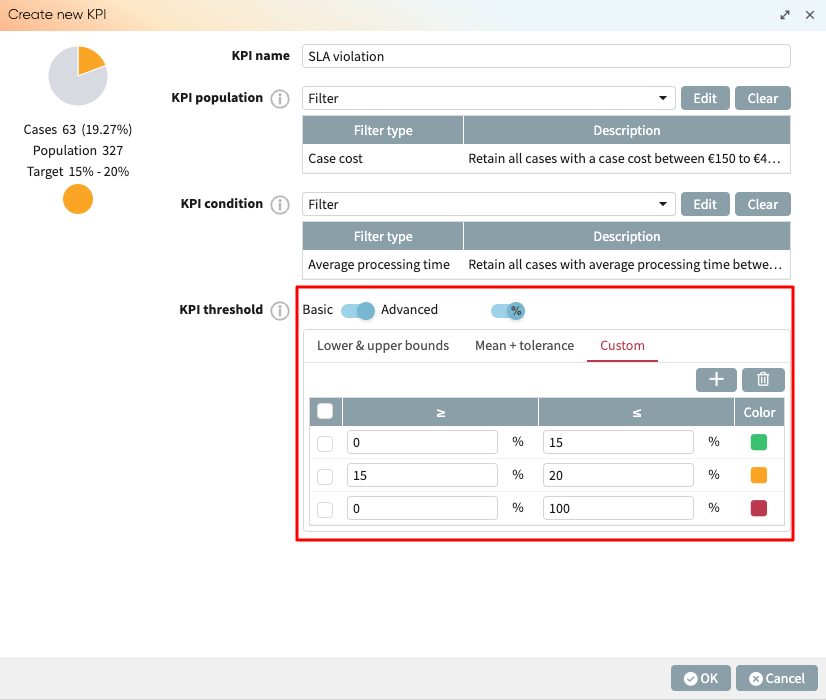
Click the “+” sign to add a new range and associated color. We’d add the range for amber and red colors.
Note
We may delete a range and its associated color by clicking the tick box to the left and the thrash bin button  .
.
Click OK to save the KPI.
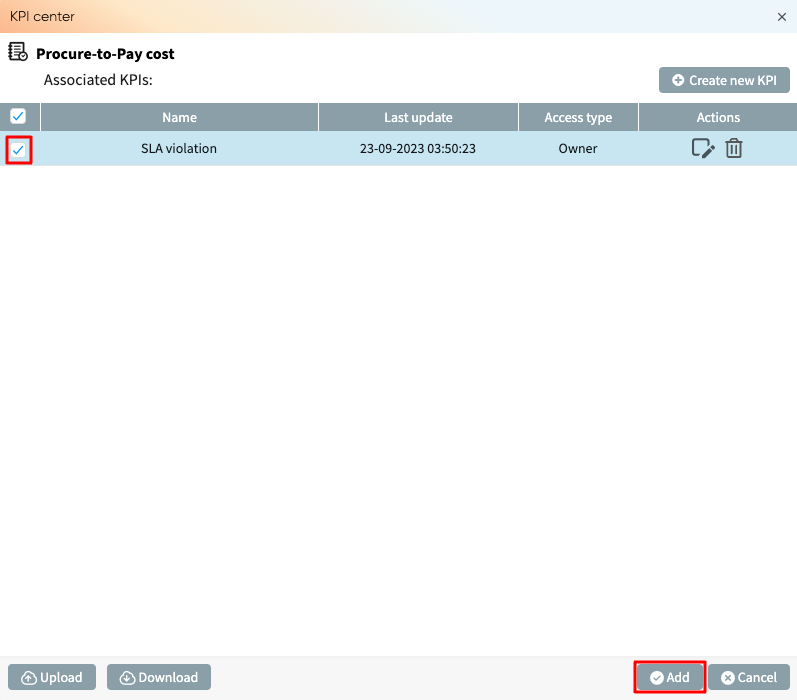
The KPI is saved and appears in the KPI center. This KPI can be attached to the log by ticking the KPI and clicking Add.
Download and upload KPIs
KPIs in the KPI center can be downloaded as a file.
To download a KPI, open the KPI center. From Apromore Portal, click the Manage KPIs icon .
This opens the KPI center window. Click the KPI we wish to download and click Download.
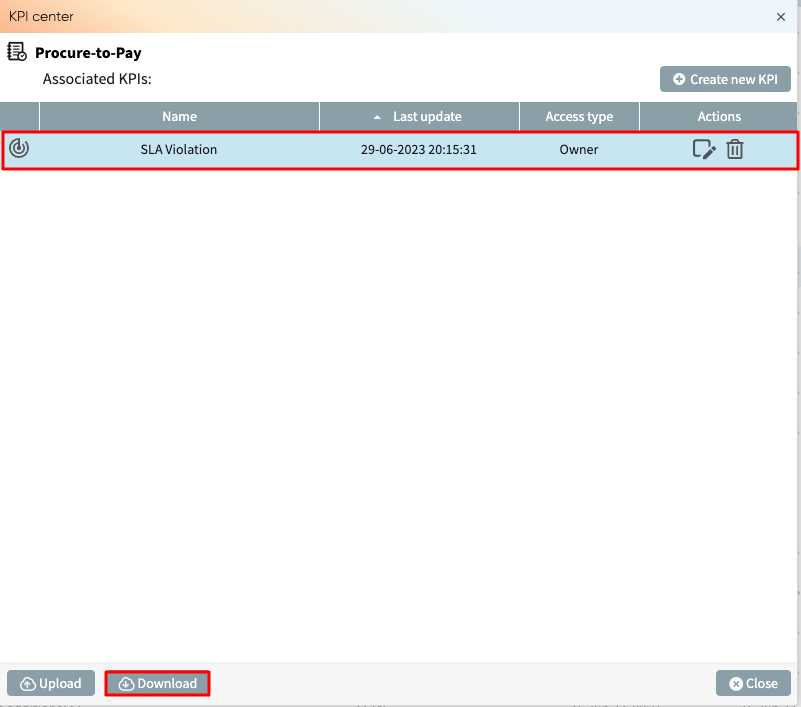
The KPI is downloaded as a zipped JSON file on our local machine.
Conversely, we can upload a KPI as a JSON file. To upload a KPI, click Upload in the KPI center.
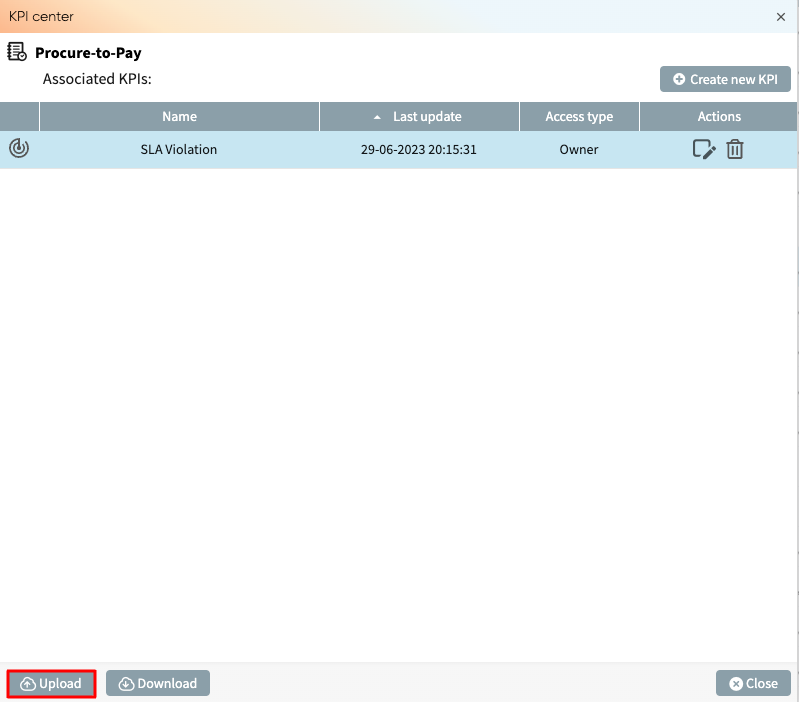
Select the KPI as a JSON file we wish to upload. The file will be loaded to our KPI center.
Use KPIs in Dashboards
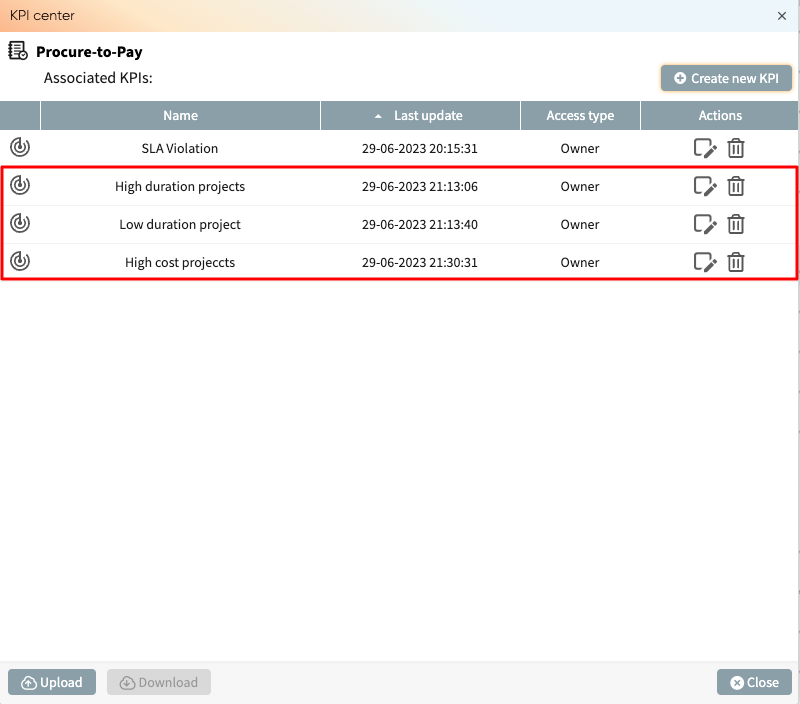
Apromore allows us to use KPIs in dashboards. To demonstrate the use of KPIs in dashboards, three other KPIs have been created and added to the KPI center. The KPIs are named Low duration projects, Low duration projects, and High-cost projects.
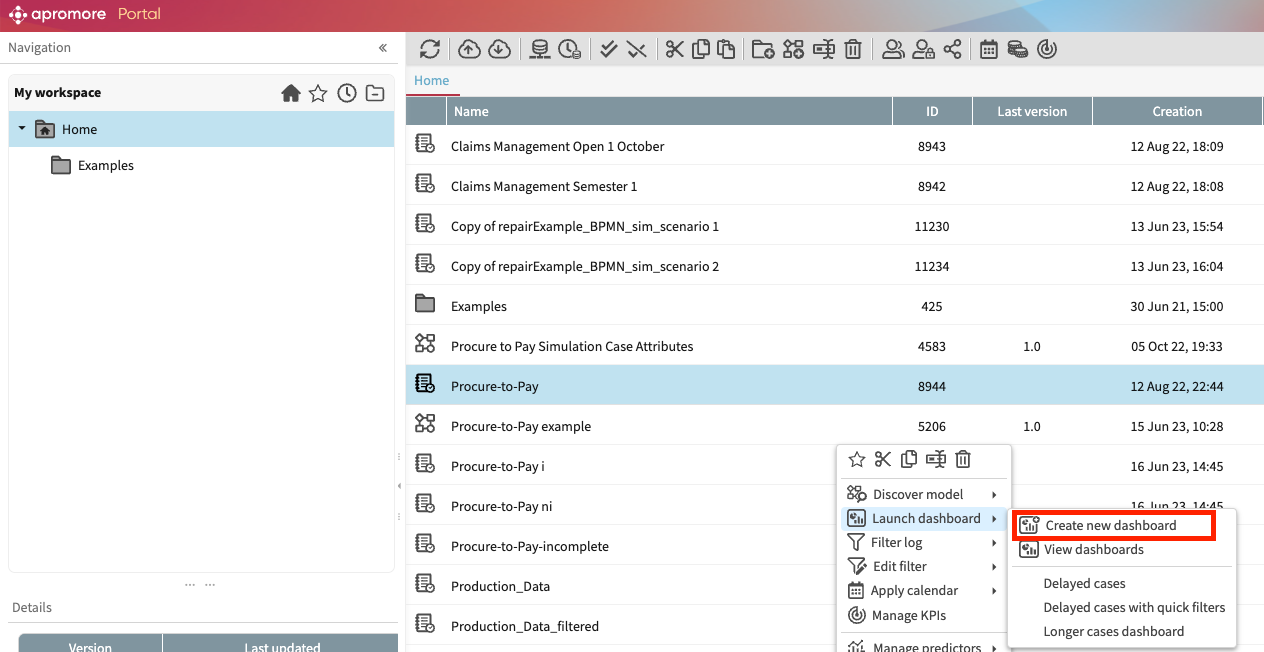
To use a KPI in a dashboard, right-click on an event log on Apromore Portal and click Launch dashboard > Create a new dashboard.
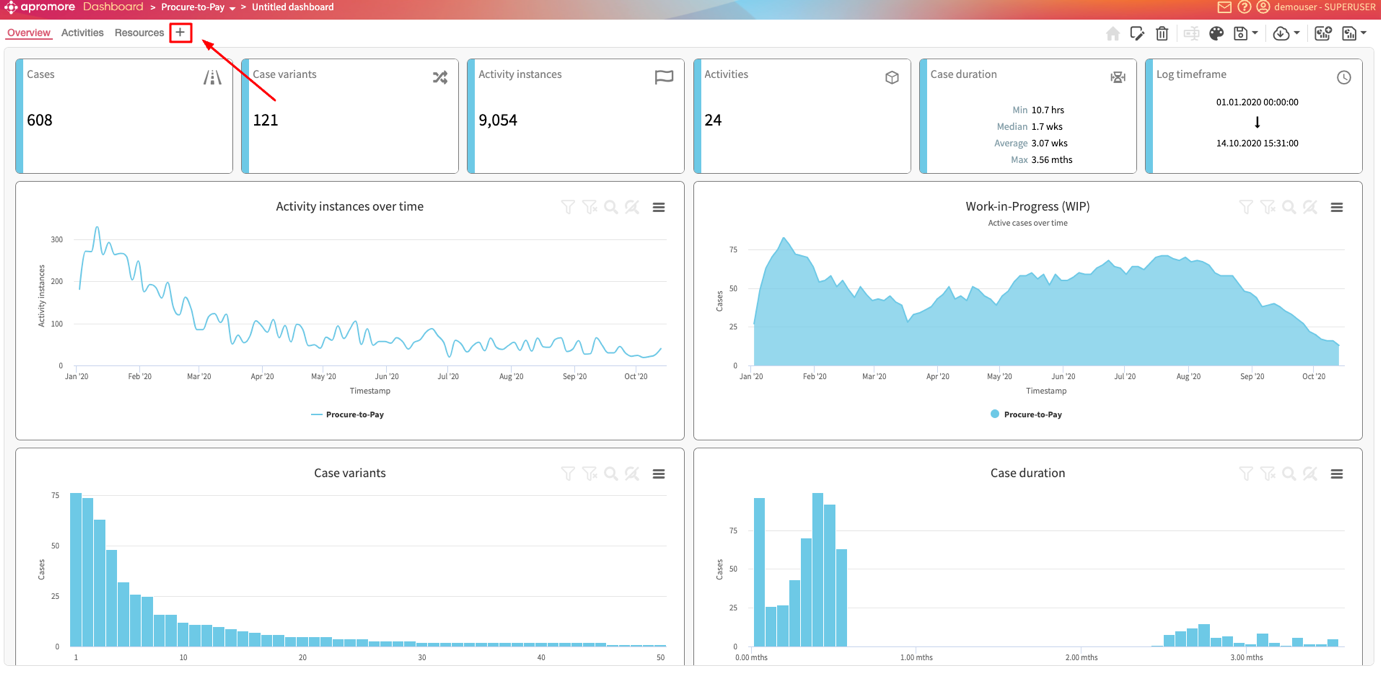
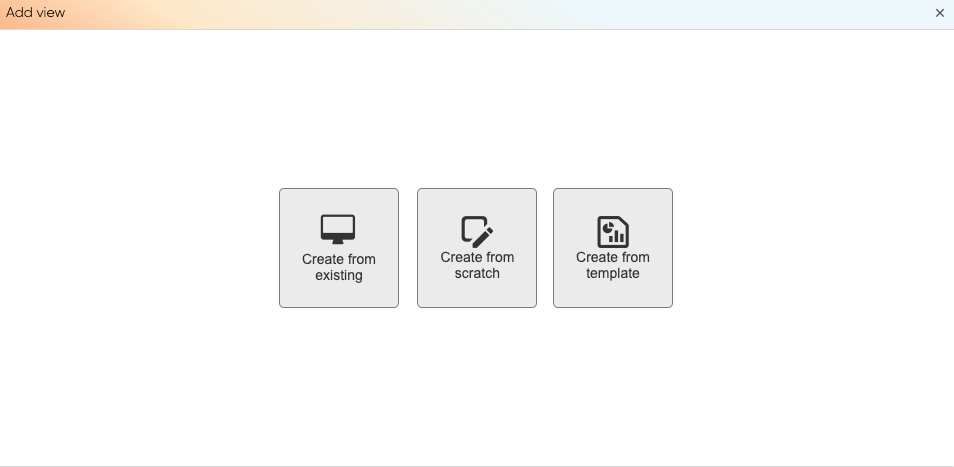
We can add a new dashboard view. Click the “+” button in the top left corner.
Click Create from scratch.
Note
We can also create the new view from an existing dashboard.
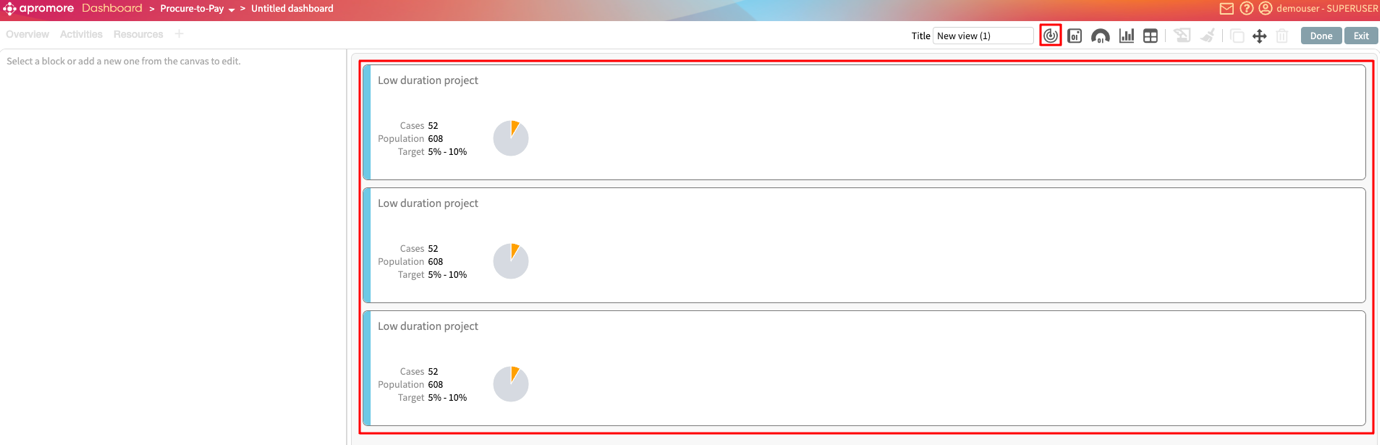
In the new dashboard view, click the Add KPI icon  .
It adds one of the KPIs to the dashboard.
Click the KPI icon twice to add two more KPIs to the dashboard.
.
It adds one of the KPIs to the dashboard.
Click the KPI icon twice to add two more KPIs to the dashboard.
Click on a KPI to edit it.
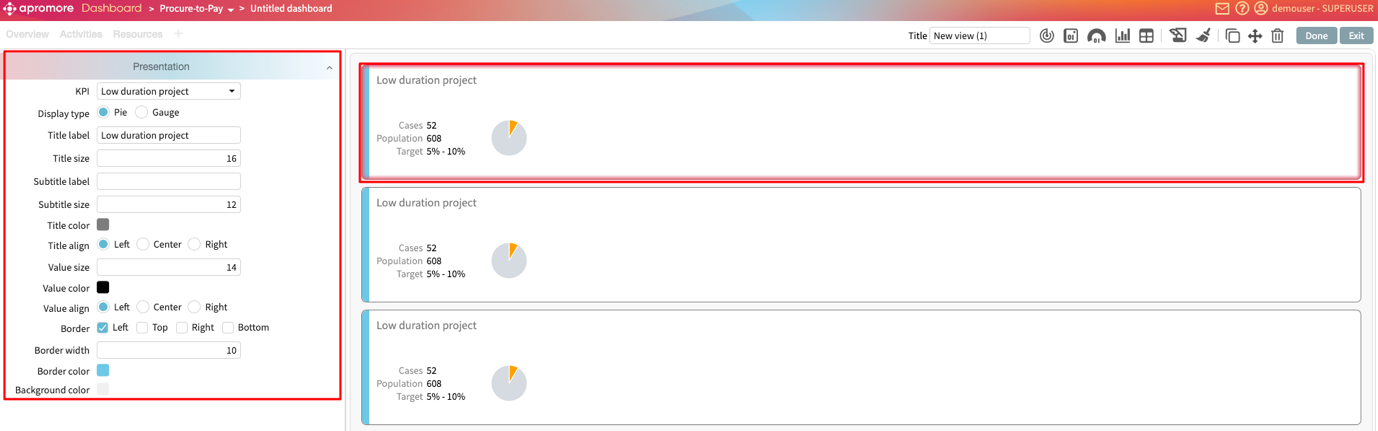
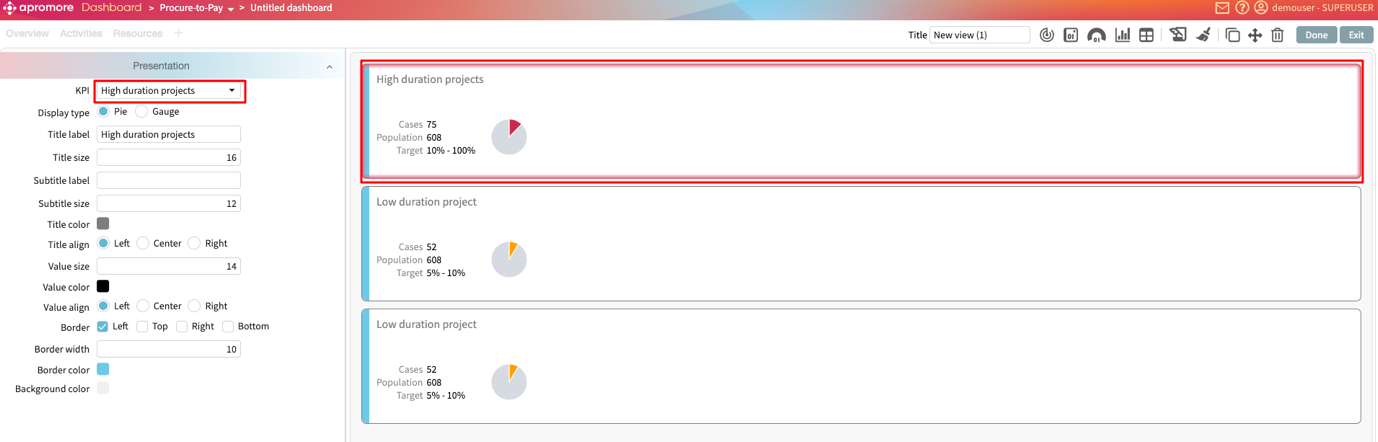
In the Presentation view, click the KPI dropdown to select a KPI we wish to display.
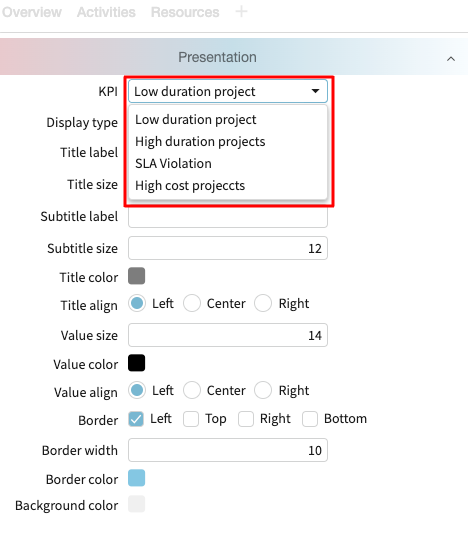
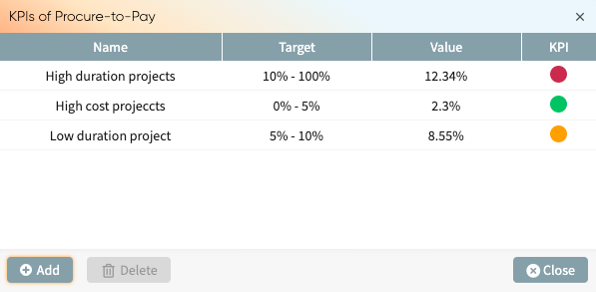
If we click High duration project, the High duration project KPI appears in the dashboard.
Similarly, we can edit the following KPI to display High cost projects KPI.
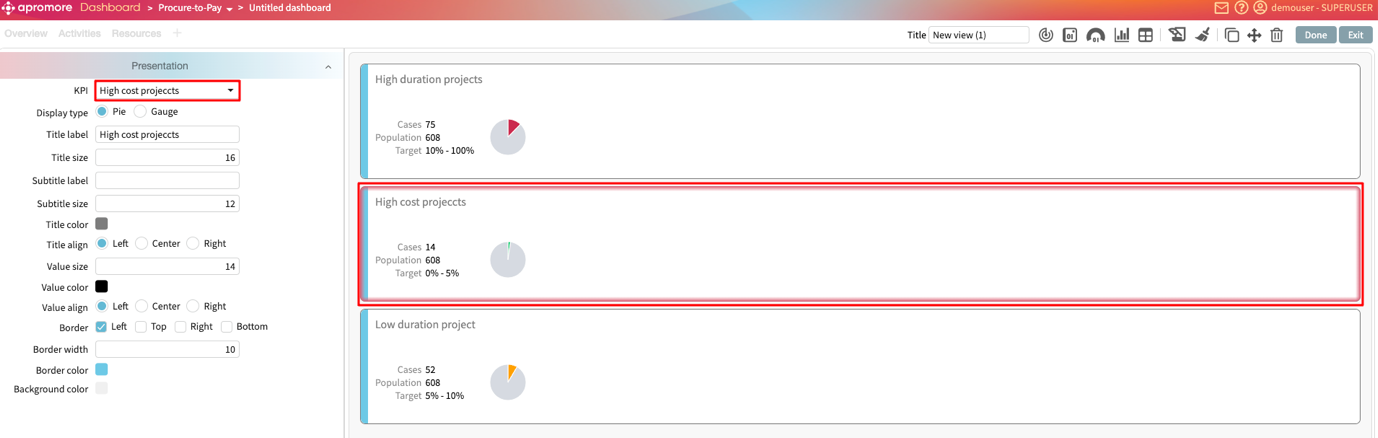
The dashboard reveals that for the High duration projects KPI, 75 of 608 cases satisfy the condition which falls in the red color range. In the low-duration projects, 52 of 608 cases satisfy the set condition for the amber color. Lastly, 14 of 608 satisfies the condition specified in the High cost projects KPI; thus, green appears.
Note
For a dynamic event log, i.e., when there is a defined ETL pipeline for the event log, the KPIs in the dashboard are automatically updated based on the current event log.
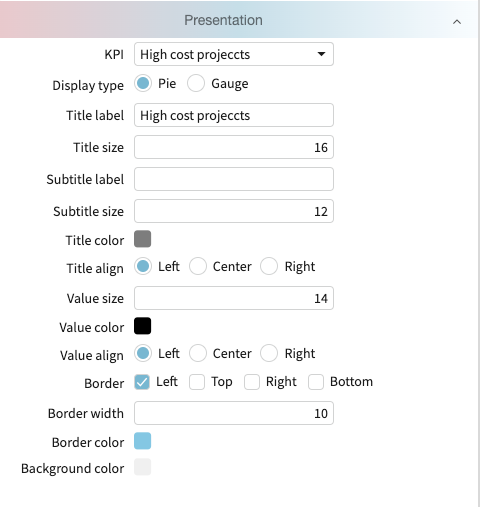
We can customize the visualization in the dashboard further using the settings in the presentation tab.
Use KPIs in Process Discoverer
Apromore allows us to use KPIs in Process Discoverer as well. When a KPI is added in Process Discoverer, it displays the KPI overview. To add one or more KPI to Process Discoverer on the Apromore Portal, double-click an event log to open it.
Click the Manage KPIs icon .
Click Add to add KPIs to the event log.
The KPI center window appears, showing a list of already created KPIs.
Mark one or more KPIs to add and click Add.
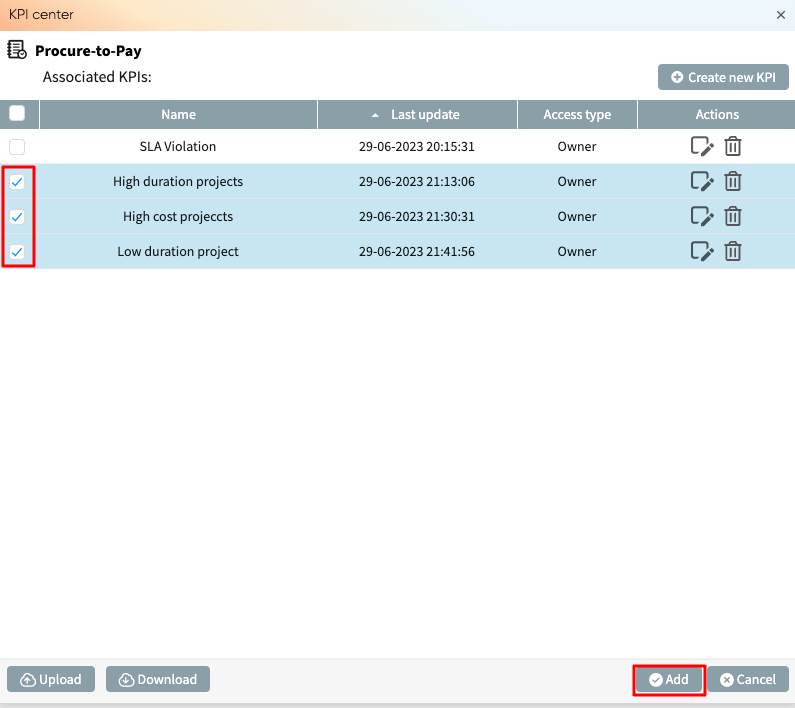
Each KPI, alongside its color code, is displayed.
We may add or delete KPIs by clicking Add or Delete, respectively.
Perform root cause analysis
As a process manager or analyst, when a KPI target is not met, we need to understand which cases are more likely to violate the KPI. This information can help us to identify KPI violation causes and corrective actions.
To help in such investigations, the Root Cause Analyzer of the KPI Center displays a list of conditions under which the risk of KPI violation is considerably higher when this condition holds compared to when the condition does not hold.
For example, given a KPI that states that at least 95% of cases should have a duration below 12 days, the Root Cause Analyzer generates a list of statements such as the following:
The KPI violation rate when “Invoice Amount” >= 50K is 7% versus 3% otherwise.
The KPI violation rate when “Country” is “Canada” is 2% versus 6% otherwise.
The first of these statements indicates a negative deviance: the subpopulation of cases where the Invoice Amount is above 50K needs further attention. The second statement indicates positive deviance: The cases in Canada are handled more efficiently than others, suggesting that there is something to learn from how cases are handled in Canada.
We can sort the findings based on several metrics that are common in the field of risk analysis:
Violation rate: The percentage of cases in the KPI’s population that fulfill the condition and violate the KPI. In the first of the above examples, the conditional KPI violation rate for the condition “Country” is “Canada” is 2%.
Inverse violation rate: The percentage of cases in the KPI’s population that do NOT fulfill the condition and violate the KPI. In the first of the above examples, the inverse KPI violation rate for the condition “Country” is “Canada” is 6%.
Risk increase: The difference between the KPI violation rate and the inverse KPI violation rate. A risk increase of 5% tells us that if a case fulfills the condition, the probability of this case violating the KPI is 5 percentage-points higher than if it does not.
Risk ratio: The ratio of the KPI violation rate to the inverse KPI violation rate. A risk ratio of 2 tells us that cases that fulfill the condition are twice more likely to violate the KPI than cases that do not.
Sub-population: The number of cases in the KPI population that fulfill the condition.
Sub-population percentage: The percentage of the subpopulation size to the KPI’s population.
A finding is negative if the risk increase is positive. In this case, the finding tells us that a condition under which the KPI violation rate increases. Conversely, a finding is positive if the risk increase is negative (the finding suggests a condition under which the KPI violation rate decreases).
The Root Cause Analyzer retrieves the findings that are most “informative”. The informativeness of a finding is measured using decision tree mining techniques.
To investigate the possible root causes of KPI violations with the Root Cause Analyze, open the KPI Center on a log (in the Portal or Process Discoverer).
Add a KPI to be analyzed.
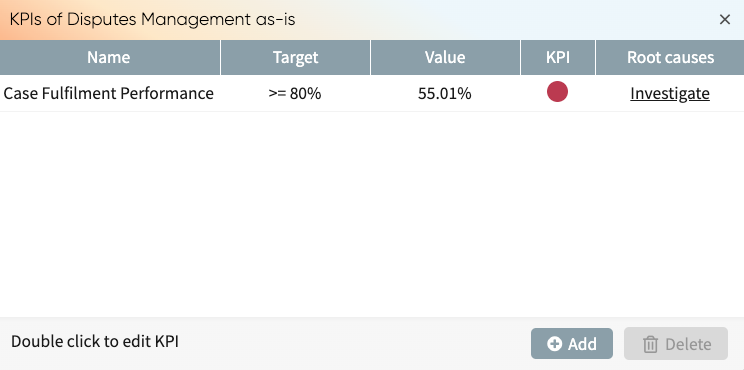
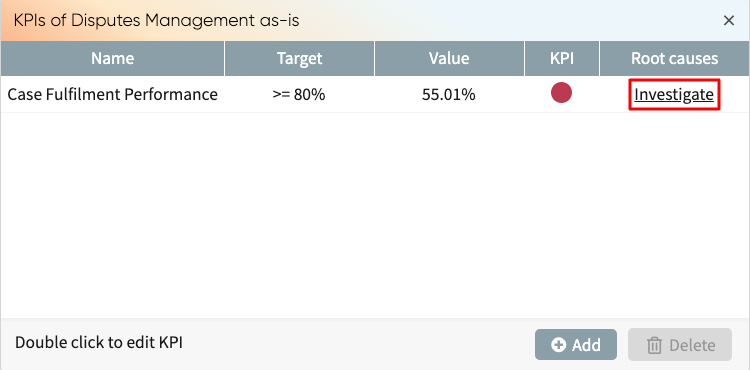
In our example, we have defined a KPI, “Case Fulfilment Performance”, that flags cases with a case duration greater than 2 weeks.
Click Investigate next to the KPI to analyze its possible causes.
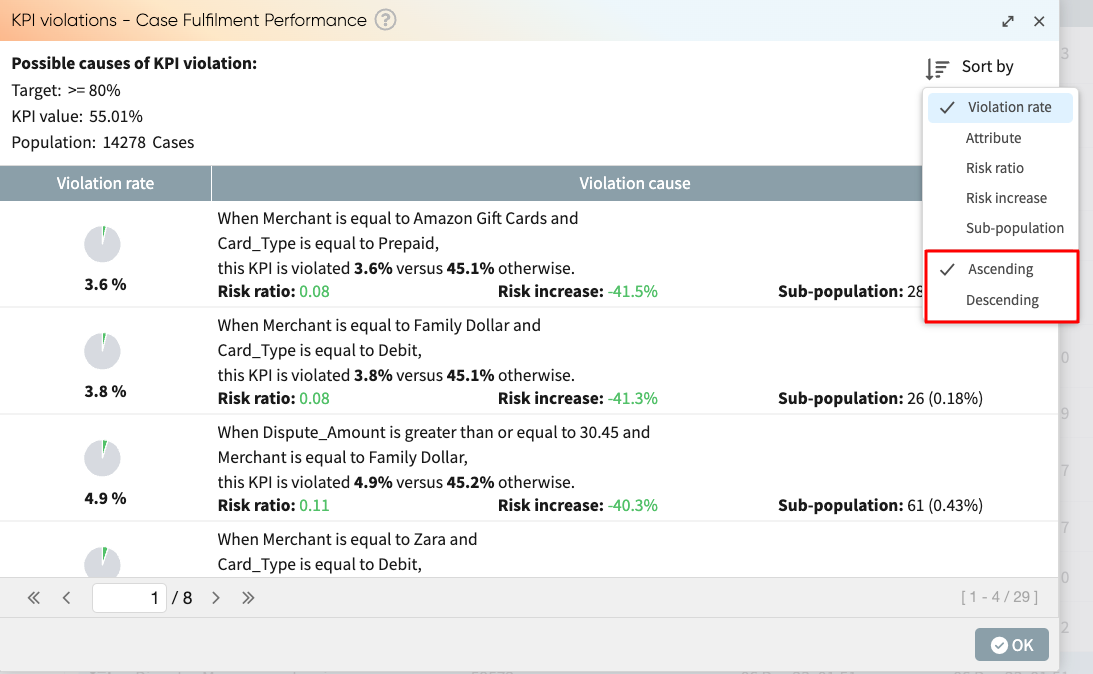
This opens the KPI Root Cause Analyzer window for the selected KPI.
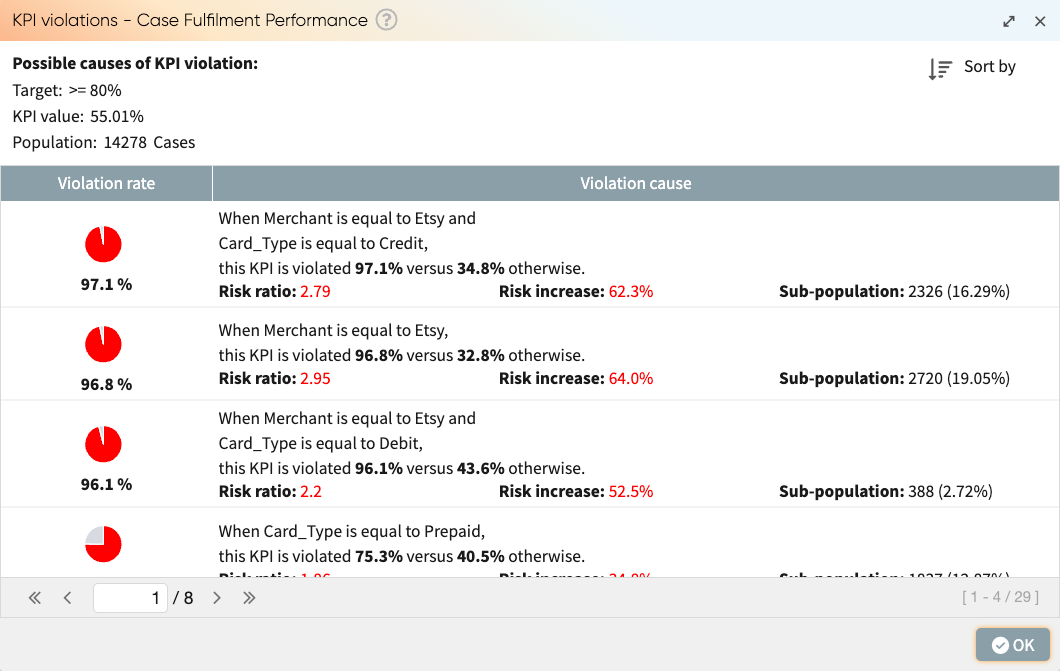
The KPI Root Cause Analyzer window displays a list of “findings”. Each finding appears as a card and consists of a textual description and the metrics of this finding: risk ratio, risk increase, subpopulation size, and subpopulation percentage. Note that the KPI violation rate and the inverse KPI violation rate are included in the description.
A finding can have complex conditions, consisting of more than one predicate, such as: Merchant = “Etsy” and CardType = “Credit”. This helps us understand specific contributing factors to the KPI violations.
We can sort the list of findings in ascending or descending order according to:
Violation rate
Attribute name
Risk ratio
Risk increase
Sub-population
To change how the findings are sorted, click the Sort by icon  .
.
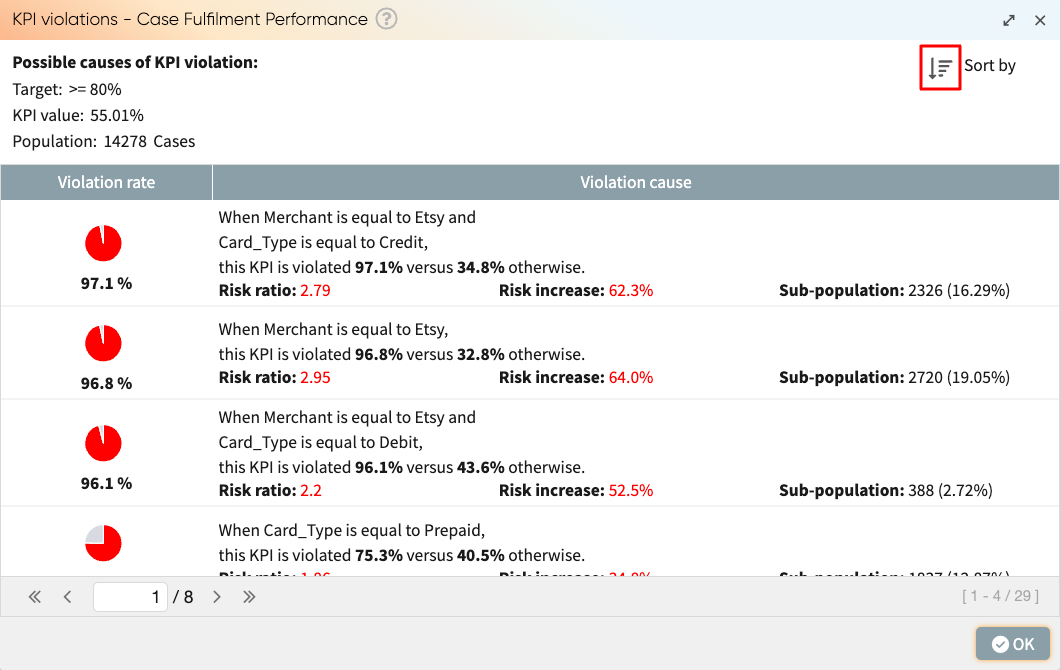
Select the metric we wish to sort by.
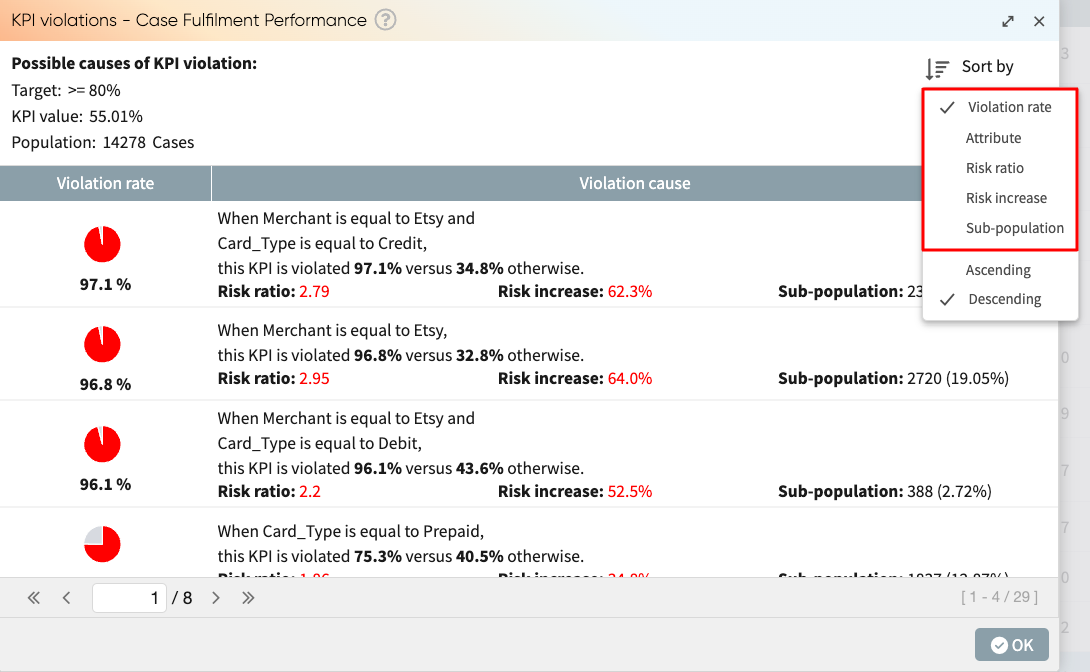
To sort in ascending or descending order, click the Sort by icon .
Select Ascending or Descending.
The findings are now listed by the selected metric in ascending or descending order.